swanlab.echarts.pr_curve
python
pr_curve(
    y_true: Union[List, np.ndarray],
    y_pred_proba: Union[List, np.ndarray],
    title: Optional[str, bool] = None,
) -> None| 参数 | 描述 |
|---|---|
| y_true | (Union[List, np.ndarray]) 真实标签,二分类问题中的真实类别标签(0或1) |
| y_pred_proba | (Union[List, np.ndarray]) 预测概率,模型对正类的预测概率值(范围0-1) |
| title | (Optional[str, bool]) 是否显示图表标题,默认为None |
介绍
绘制PR(Precision-Recall)曲线,用于评估二分类模型的性能。PR曲线展示了在不同阈值下精确率(Precision)和召回率(Recall)的关系。
PR曲线特别适用于处理不平衡数据集,能够更好地评估模型在少数类上的表现。
基本用法
python
from sklearn.datasets import make_classification
from sklearn.model_selection import train_test_split
import xgboost as xgb
import swanlab

# 生成示例数据
X, y = make_classification(n_samples=1000, n_features=20, n_informative=2, n_redundant=10, random_state=42)
X_train, X_test, y_train, y_test = train_test_split(X, y, test_size=0.3, random_state=42)

# 训练模型
model = xgb.XGBClassifier(use_label_encoder=False, eval_metric='logloss')
model.fit(X_train, y_train)

# 获取预测概率
y_pred_proba = model.predict_proba(X_test)[:, 1]

# 初始化SwanLab
swanlab.init(project="PR-Curve-Demo", experiment_name="PR-Curve-Example")

# 记录PR曲线
swanlab.log({
    "pr_curve": swanlab.echarts.pr_curve(y_test, y_pred_proba, title=True)
})

swanlab.finish()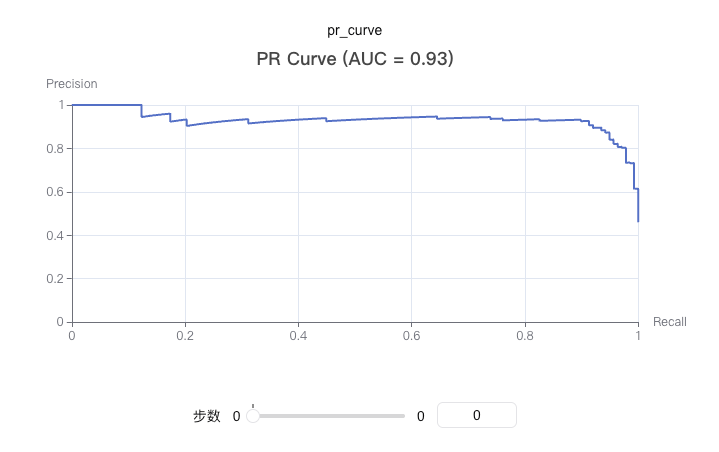
自定义标题
python
# 不显示标题(默认)
pr_curve = swanlab.echarts.pr_curve(y_test, y_pred_proba, title=False)
swanlab.log({"pr_curve_no_title": pr_curve})

# 显示标题
pr_curve = swanlab.echarts.pr_curve(y_test, y_pred_proba, title=True)
swanlab.log({"pr_curve_with_title": pr_curve})

# 自定义标题
pr_curve = swanlab.echarts.pr_curve(y_test, y_pred_proba, title="demo")
swanlab.log({"pr_curve_with_custom_title": pr_curve})
注意事项
- 数据格式:
y_true和y_pred_proba可以是列表或numpy数组 - 二分类: 此函数专用于二分类问题
- 概率值:
y_pred_proba应该是模型对正类的预测概率,范围在0-1之间 - 依赖包: 需要安装
scikit-learn和pyecharts包 - AUC计算: 函数会自动计算PR曲线下的面积(AUC),但不会默认在标题中显示