

可观测配置指南
本文档介绍利用
Prometheus + Grafana监控 SwanLab 私有化服务的配置方法,日志接入请参考 日志接入指南。
INFO
受限于各类集群权限要求,自私有化 App ≥ 3.0.0 版本起,SwanLab 采用 Prometheus + Grafana + Alertmanager 独立部署的监控模式。
☀️ 架构概述
SwanLab 私有化部署采用微服务架构,各应用服务按照职责拆分并独立运行,整体监控链路如下:
- Prometheus 定期抓取 SwanLab 各服务暴露的
/metrics接口。 - Grafana 从 Prometheus 读取数据,渲染 SwanLab 的监控仪表盘与告警面板。
- 「可选」Alertmanager 或您已有的告警系统,在 Prometheus 告警规则触发时发送通知。
🪜 流程示意

🧱 前置条件
- 已通过 Helm 安装 SwanLab 私有化服务(参考 Kubernetes 部署指南)
- 对 SwanLab 私有化服务所在命名空间具有 admin 权限
- 应用默认
release_name为swanlab-self-hosted,安装命名空间为<your_namespace>,存储类为<your_storageclass>(请根据实际情况替换)
下表为 SwanLab 服务目前支持直接访问 metrics 信息的应用和对应接口配置、路由:
| 服务名称 | 服务说明 | 端口 | 路由 |
|---|---|---|---|
| SwanLab-Server | 后端核心业务服务 | 3000 | /metrics |
| SwanLab-Auth | 认证与鉴权服务 | 3000 | /metrics |
| SwanLab-House | 实验指标 OLAP 服务 | 3000 | /metrics |
| Vector | 指标聚合转发 | 9090 | /metrics |
如果 Redis / PostgreSQL / ClickHouse 等基础数据库服务未外部集成,则需要额外部署对应的 Exporter 采集服务,将可观测指标转发到 Prometheus(见下文 2.2 节)。
在实际配置 Prometheus 抓取任务前,建议先验证各服务的 Metrics 接口是否正常:
- 验证 SwanLab-Server
kubectl exec -n <your_namespace> -c server "$(
  kubectl get pod -n <your_namespace> \
    -l app.kubernetes.io/instance=swanlab-self-hosted,app.kubernetes.io/service=server \
    -o jsonpath='{.items[0].metadata.name}'
)" -- wget -qO- http://127.0.0.1:3000/metrics- 验证 SwanLab-Auth
kubectl exec -n <your_namespace> -c auth "$(
  kubectl get pod -n <your_namespace> \
    -l app.kubernetes.io/instance=swanlab-self-hosted,app.kubernetes.io/service=auth \
    -o jsonpath='{.items[0].metadata.name}'
)" -- wget -qO- http://127.0.0.1:3000/metrics- 验证 SwanLab-House
kubectl exec -n <your_namespace> -c house "$(
  kubectl get pod -n <your_namespace> \
    -l app.kubernetes.io/instance=swanlab-self-hosted,app.kubernetes.io/service=house \
    -o jsonpath='{.items[0].metadata.name}'
)" -- wget -qO- http://127.0.0.1:3000/metrics
其中:
app.kubernetes.io/instance=<release_name>中的<release_name>为 Helm RELEASE 名称(默认swanlab-self-hosted),请按实际部署情况替换<your_namespace>替换为实际部署使用的集群命名空间
📊 可观测监控服务
1. 开启 values 监控配置
在 values.yaml 中,为需要采集可观测指标的服务开启 monitor 配置,示例如下:
# 应用服务
service:
  server:
    # ...
    # 是否开启监控采集专用 Headless Service
    monitor:
      enable: true
  auth:
    # ...
    # 是否开启监控采集专用 Headless Service
    monitor:
      enable: true
  house:
    # ...
    monitor:
      enable: true

# Vector 日志聚合
vector:
  # ...
  monitor:
    enable: true

# 基础组件服务
dependencies:
  # ...
  clickhouse:
    # ...
    # 是否开启监控采集专用 Headless Service
    monitor:
      enable: true
WARNING
dependencies 下的数据库依赖服务仅在未集成外部服务的情况下才能生效。
修改完 values.yaml 后执行更新:
helm upgrade swanlab-self-hosted <path_to_chart> -n <your_namespace>更新完成后,每个开启了 monitor 配置的服务都会额外创建一个独立的 monitor Headless Service,专用于可观测指标采集。
2. 安装 SwanLab-Monitor 独立监控
SwanLab-Monitor 集成了 Prometheus + Grafana 的部署清单与可观测指标的采集、告警配置,需要在 SwanLab 所在命名空间下安装两个单实例 StatefulSet 服务,模板如下:
2.1 Prometheus + Grafana 监控服务安装
swanlab-monitor.yaml 模板
# ============================================================
# SwanLab Monitor — Prometheus + Grafana 监控栈
# 抓取方式:通过监控专用 Headless Service 的 DNS A 记录逐 Pod 抓取,无需访问 K8s API
# 占位符:<your_namespace>(命名空间)、<your_storageclass>(StorageClass)
# ============================================================
# ---------- Prometheus ConfigMap ----------
apiVersion: v1
kind: ConfigMap
metadata:
name: swanlab-monitor-prometheus-config
namespace: <your_namespace>
labels:
app.kubernetes.io/name: prometheus
app.kubernetes.io/instance: swanlab-monitor
data:
prometheus.yml: |
global:
scrape_interval: 30s
evaluation_interval: 30s
external_labels:
monitor: swanlab-monitor
scrape_configs:
# ---- SwanLab Server ----
# dns_sd 通过监控专用 Headless Service 的 A 记录发现所有 Pod IP
# relabel_configs 静态注入 namespace / service 标签,匹配 Grafana 看板变量
- job_name: "swanlab-server"
metrics_path: /metrics
dns_sd_configs:
- names:
- swanlab-self-hosted-server-monitor.<your_namespace>.svc.cluster.local
type: A
port: 3000
relabel_configs:
- target_label: namespace
replacement: <your_namespace>
- target_label: service
replacement: server
# ---- SwanLab House ----
- job_name: "swanlab-house"
metrics_path: /metrics
dns_sd_configs:
- names:
- swanlab-self-hosted-house-monitor.<your_namespace>.svc.cluster.local
type: A
port: 3000
relabel_configs:
- target_label: namespace
replacement: <your_namespace>
- target_label: service
replacement: house
# ---- SwanLab Auth ----
- job_name: "swanlab-auth"
metrics_path: /metrics
dns_sd_configs:
- names:
- swanlab-self-hosted-auth-monitor.<your_namespace>.svc.cluster.local
type: A
port: 3000
relabel_configs:
- target_label: namespace
replacement: <your_namespace>
- target_label: service
replacement: auth
# ---- Vector 日志聚合(内置 prometheus_exporter,端口 9090)----
- job_name: "swanlab-vector"
metrics_path: /metrics
dns_sd_configs:
- names:
- swanlab-self-hosted-vector-monitor.<your_namespace>.svc.cluster.local
type: A
port: 9090
relabel_configs:
- target_label: namespace
replacement: <your_namespace>
- target_label: service
replacement: vector
# ---- ClickHouse 数据库(内置 exporter,端口 9363,仅未外部集成时生效)----
- job_name: "swanlab-clickhouse"
metrics_path: /metrics
dns_sd_configs:
- names:
- swanlab-self-hosted-clickhouse-monitor.<your_namespace>.svc.cluster.local
type: A
port: 9363
relabel_configs:
- target_label: namespace
replacement: <your_namespace>
- target_label: service
replacement: clickhouse
# ---- ClickHouse per-table exporter(端口 9364,需部署 clickhouse-exporter.yaml)----
- job_name: "swanlab-clickhouse-tables"
metrics_path: /metrics
static_configs:
- targets:
- swanlab-monitor-ch-table-exporter.<your_namespace>:9364
relabel_configs:
- target_label: namespace
replacement: <your_namespace>
- target_label: service
replacement: clickhouse
# ---- PostgreSQL exporter(端口 9187,需部署 postgres-exporter.yaml)----
- job_name: "swanlab-postgres"
metrics_path: /metrics
static_configs:
- targets:
- swanlab-monitor-postgres-exporter.<your_namespace>:9187
relabel_configs:
- target_label: namespace
replacement: <your_namespace>
- target_label: service
replacement: postgres
# ---- Redis exporter(端口 9121,需部署 redis-exporter.yaml)----
- job_name: "swanlab-redis"
metrics_path: /metrics
static_configs:
- targets:
- swanlab-monitor-redis-exporter.<your_namespace>:9121
relabel_configs:
- target_label: namespace
replacement: <your_namespace>
- target_label: service
replacement: redis
# ---- Prometheus 自身 ----
- job_name: "prometheus"
static_configs:
- targets: ["localhost:9090"]
rule_files:
- /etc/prometheus/rules/*.yml
# ---- 对接 Alertmanager(可选,由 swanlab-monitor-alertmanager.yaml 创建)----
alerting:
alertmanagers:
- static_configs:
- targets:
- swanlab-monitor-alertmanager.<your_namespace>:9093
---
# ---------- Prometheus StatefulSet ----------
apiVersion: apps/v1
kind: StatefulSet
metadata:
name: swanlab-monitor-prometheus
namespace: <your_namespace>
labels:
app.kubernetes.io/name: prometheus
app.kubernetes.io/instance: swanlab-monitor
spec:
serviceName: swanlab-monitor-prometheus
replicas: 1
updateStrategy:
type: RollingUpdate
selector:
matchLabels:
app.kubernetes.io/name: prometheus
app.kubernetes.io/instance: swanlab-monitor
template:
metadata:
labels:
app.kubernetes.io/name: prometheus
app.kubernetes.io/instance: swanlab-monitor
spec:
# 显式声明使用 default SA + 禁用 token 自动挂载(Prometheus 无需访问 K8s API)
serviceAccountName: default
automountServiceAccountToken: false
securityContext:
fsGroup: 65534
runAsUser: 65534
runAsGroup: 65534
runAsNonRoot: true
seccompProfile:
type: RuntimeDefault
containers:
- name: prometheus
image: repo.swanlab.cn/public/prometheus:v3.12.0-distroless
imagePullPolicy: IfNotPresent
securityContext: # 容器级加固:禁提权 + 弃所有 capabilities + 只读根文件系统
allowPrivilegeEscalation: false
capabilities:
drop: ["ALL"]
readOnlyRootFilesystem: true
args:
- "--config.file=/etc/prometheus/prometheus.yml"
- "--storage.tsdb.path=/prometheus"
- "--storage.tsdb.retention.time=7d" # ← 可按需修改保留时长(7d/15d/30d 等)
- "--storage.tsdb.retention.size=15GiB" # ← 可按需修改保留大小,不得超过 PVC 容量
- "--web.enable-lifecycle"
ports:
- name: web
containerPort: 9090
volumeMounts:
- name: config
mountPath: /etc/prometheus
readOnly: true
- name: rules
mountPath: /etc/prometheus/rules
readOnly: true
- name: data
mountPath: /prometheus
- name: tmp # 只读根文件系统下用于写临时文件
mountPath: /tmp
readinessProbe:
httpGet:
path: /-/ready
port: web
initialDelaySeconds: 10
periodSeconds: 10
livenessProbe:
httpGet:
path: /-/healthy
port: web
initialDelaySeconds: 30
periodSeconds: 30
resources:
requests:
cpu: "500m"
memory: "512Mi"
limits:
cpu: "1000m"
memory: "1Gi"
volumes:
- name: config
configMap:
name: swanlab-monitor-prometheus-config
- name: rules
configMap:
name: swanlab-monitor-prometheus-rules
- name: tmp
emptyDir: {}
volumeClaimTemplates:
- metadata:
name: data
spec:
accessModes: ["ReadWriteOnce"]
resources:
requests:
storage: "20Gi" # ← 可按需修改存储大小
storageClassName: <your_storageclass> # ← 需要修改为集群中对应的 storageClass
volumeMode: Filesystem
---
# ---------- Prometheus Service ----------
apiVersion: v1
kind: Service
metadata:
name: swanlab-monitor-prometheus
namespace: <your_namespace>
labels:
app.kubernetes.io/name: prometheus
app.kubernetes.io/instance: swanlab-monitor
spec:
type: ClusterIP
ports:
- name: web
port: 9090
targetPort: web
selector:
app.kubernetes.io/name: prometheus
app.kubernetes.io/instance: swanlab-monitor
---
# ---------- Grafana Datasources ConfigMap ----------
apiVersion: v1
kind: ConfigMap
metadata:
name: swanlab-monitor-grafana-datasources
namespace: <your_namespace>
labels:
app.kubernetes.io/name: grafana
app.kubernetes.io/instance: swanlab-monitor
data:
datasources.yaml: |
apiVersion: 1
datasources:
- name: Prometheus
type: prometheus
access: proxy
url: http://swanlab-monitor-prometheus.<your_namespace>:9090
isDefault: true
editable: true
---
# ---------- Grafana StatefulSet ----------
apiVersion: apps/v1
kind: StatefulSet
metadata:
name: swanlab-monitor-grafana
namespace: <your_namespace>
labels:
app.kubernetes.io/name: grafana
app.kubernetes.io/instance: swanlab-monitor
spec:
serviceName: swanlab-monitor-grafana
replicas: 1
updateStrategy:
type: RollingUpdate
selector:
matchLabels:
app.kubernetes.io/name: grafana
app.kubernetes.io/instance: swanlab-monitor
template:
metadata:
labels:
app.kubernetes.io/name: grafana
app.kubernetes.io/instance: swanlab-monitor
spec:
serviceAccountName: default
automountServiceAccountToken: false
securityContext:
fsGroup: 472
runAsNonRoot: true
runAsUser: 472
runAsGroup: 472
seccompProfile:
type: RuntimeDefault
containers:
- name: grafana
image: repo.swanlab.cn/public/grafana:13.0.1-security-01
imagePullPolicy: IfNotPresent
securityContext: # 容器级加固:禁提权 + 弃所有 capabilities + 只读根文件系统
allowPrivilegeEscalation: false
capabilities:
drop: ["ALL"]
readOnlyRootFilesystem: true
env:
- name: GF_SECURITY_ADMIN_PASSWORD
value: "swanlab-monitor@default" # ← 建议修改默认管理员密码
- name: GF_USERS_ALLOW_SIGN_UP
value: "false"
- name: GF_SERVER_HTTP_PORT
value: "3000"
ports:
- name: http
containerPort: 3000
volumeMounts:
- name: data
mountPath: /var/lib/grafana
- name: provisioning-datasources
mountPath: /etc/grafana/provisioning/datasources
readOnly: true
- name: tmp # 只读根文件系统下用于写临时文件
mountPath: /tmp
readinessProbe:
httpGet:
path: /api/health
port: http
initialDelaySeconds: 15
periodSeconds: 10
livenessProbe:
httpGet:
path: /api/health
port: http
initialDelaySeconds: 45
periodSeconds: 30
resources:
requests:
cpu: "500m"
memory: "512Mi"
limits:
cpu: "1"
memory: "1Gi"
volumes:
- name: provisioning-datasources
configMap:
name: swanlab-monitor-grafana-datasources
- name: tmp
emptyDir: {}
volumeClaimTemplates:
- metadata:
name: data
spec:
accessModes: ["ReadWriteOnce"]
resources:
requests:
storage: "20Gi" # ← 可按需修改存储大小
storageClassName: <your_storageclass> # ← 需要修改为集群中对应的 storageClass
volumeMode: Filesystem
---
# ---------- Grafana Service ----------
apiVersion: v1
kind: Service
metadata:
name: swanlab-monitor-grafana
namespace: <your_namespace>
labels:
app.kubernetes.io/name: grafana
app.kubernetes.io/instance: swanlab-monitor
spec:
type: ClusterIP
ports:
- name: http
port: 80
targetPort: http
selector:
app.kubernetes.io/name: grafana
app.kubernetes.io/instance: swanlab-monitor
---
# ---------- Prometheus Rules ConfigMap ----------
apiVersion: v1
kind: ConfigMap
metadata:
name: swanlab-monitor-prometheus-rules
namespace: <your_namespace>
labels:
app.kubernetes.io/name: prometheus
app.kubernetes.io/instance: swanlab-monitor
data:
swanlab-alerts.yml: |
# firing 告警由 Alertmanager 处理(见 swanlab-monitor-alertmanager.yaml),按 receiver 路由到各 IM 通道
groups:
- name: swanlab-alerts
interval: 30s
rules:
# ---- 抓取健康(Server / House)----
- alert: SwanLabScrapeDown
expr: up{job=~"swanlab-(server|house)"} == 0
for: 5m
labels:
severity: critical
annotations:
summary: "{{ $labels.job }} 抓取失败"
description: "instance={{ $labels.instance }} 已离线超过 5 分钟,Prometheus 无法抓取 /metrics"
# ---- 抓取健康(Vector / ClickHouse)----
- alert: SwanLabInfraScrapeDown
expr: up{job=~"swanlab-(vector|clickhouse)"} == 0
for: 5m
labels:
severity: warning
annotations:
summary: "{{ $labels.job }} 抓取失败"
description: "instance={{ $labels.instance }} 已离线超过 5 分钟,Prometheus 无法抓取 /metrics"
# ---- 服务端 5xx / 异常错误率 ----
- alert: SwanLabHigh5xxRate
expr: |
sum by (service, namespace) (
rate(http_error_requests_total{error_type=~"server_error|exception", route!="/metrics"}[5m])
)
/
sum by (service, namespace) (
rate(http_requests_total{route!="/metrics"}[5m])
) > 0.05
for: 5m
labels:
severity: warning
annotations:
summary: "{{ $labels.service }} 5xx 错误率过高"
description: "{{ $labels.service }} 的服务端错误率超过 5%,持续 5 分钟"
# ---- panic 异常 ----
- alert: SwanLabPanicSpike
expr: rate(http_error_requests_total{error_type="exception", route!="/metrics"}[5m]) > 0
for: 1m
labels:
severity: critical
annotations:
summary: "{{ $labels.service }} 检测到 panic"
description: "instance={{ $labels.instance }} 在过去 5 分钟内出现 panic(被中间件 recover 捕获)"
# ---- P99 延迟过高 ----
- alert: SwanLabLatencyP99High
expr: |
histogram_quantile(0.99,
sum by (le, service, namespace) (
rate(http_request_duration_seconds_bucket{route!="/metrics"}[5m])
)
) > 5
for: 5m
labels:
severity: warning
annotations:
summary: "{{ $labels.service }} P99 延迟过高"
description: "{{ $labels.service }} 的 P99 延迟超过 5s,持续 5 分钟"
# ---- Pod 频繁重启 ----
- alert: SwanLabPodRestart
expr: changes(process_start_time_seconds{job=~"swanlab-(server|house)"}[10m]) > 2
for: 0m
labels:
severity: warning
annotations:
summary: "{{ $labels.service }} pod 频繁重启"
description: "instance={{ $labels.instance }} 在 10 分钟内重启超过 2 次"
# ---- ClickHouse 磁盘使用率过高 ----
- alert: SwanLabClickHouseDiskHigh
expr: |
ClickHouseAsyncMetrics_DiskUsed_default{job="swanlab-clickhouse"}
/
ClickHouseAsyncMetrics_DiskTotal_default{job="swanlab-clickhouse"} > 0.85
for: 10m
labels:
severity: warning
annotations:
summary: "ClickHouse 磁盘使用率过高"
description: "instance={{ $labels.instance }} 磁盘使用率超过 85%,持续 10 分钟"
# ---- ClickHouse Parts 数过高(TooManyParts 风险)----
- alert: SwanLabClickHouseTooManyParts
expr: ClickHouseAsyncMetrics_MaxPartCountForPartition{job="swanlab-clickhouse"} > 100
for: 10m
labels:
severity: warning
annotations:
summary: "ClickHouse Parts 数过高"
description: "instance={{ $labels.instance }} 单分区最大 Parts 数超过 100,存在 TooManyParts 风险"
# ---- Vector Disk Buffer 积压(通常说明 ClickHouse 写入消费不及时)----
- alert: SwanLabVectorDiskBufferBacklog
expr: |
(
vector_buffer_byte_size{buffer_type="disk", job="swanlab-vector"}
/ on (component_id, host)
vector_buffer_max_byte_size{buffer_type="disk", job="swanlab-vector"}
) > 0.5
for: 10m
labels:
severity: warning
annotations:
summary: "Vector Disk Buffer 积压"
description: "component={{ $labels.component_id }} host={{ $labels.host }} 磁盘缓冲区使用率超过 50%,持续 10 分钟"
# ---- PostgreSQL 宕机(exporter 无法连接或进程异常)----
- alert: SwanLabPostgresDown
expr: pg_up{job="swanlab-postgres"} == 0
for: 1m
labels:
severity: critical
annotations:
summary: "PostgreSQL 宕机"
description: "instance={{ $labels.instance }} PostgreSQL 不可用,持续 1 分钟"
# ---- PostgreSQL 连接数过高 ----
- alert: SwanLabPostgresConnectionsHigh
expr: |
sum(pg_stat_activity_count{job="swanlab-postgres"})
/
pg_settings_max_connections{job="swanlab-postgres"} > 0.8
for: 5m
labels:
severity: warning
annotations:
summary: "PostgreSQL 连接数过高"
description: "活跃连接数超过最大连接数的 80%,持续 5 分钟"
# ---- PostgreSQL 死锁(deadlocks 为累计计数器,rate > 0 表示有新增)----
- alert: SwanLabPostgresDeadlocks
expr: rate(pg_stat_database_deadlocks{job="swanlab-postgres"}[5m]) > 0
for: 1m
labels:
severity: warning
annotations:
summary: "PostgreSQL 检测到死锁"
description: "database={{ $labels.datname }} 出现新的死锁"
# ---- Redis 宕机(exporter 无法连接或进程异常)----
- alert: SwanLabRedisDown
expr: redis_up{job="swanlab-redis"} == 0
for: 1m
labels:
severity: critical
annotations:
summary: "Redis 宕机"
description: "instance={{ $labels.instance }} Redis 不可用,持续 1 分钟"
# ---- Redis 内存使用率过高(maxmemory=0 即未限制时自动跳过)----
- alert: SwanLabRedisMemoryHigh
expr: |
redis_memory_used_bytes{job="swanlab-redis"}
/ redis_memory_max_bytes{job="swanlab-redis"} > 0.85
and on(instance)
redis_memory_max_bytes{job="swanlab-redis"} > 0
for: 5m
labels:
severity: warning
annotations:
summary: "Redis 内存使用率过高"
description: "instance={{ $labels.instance }} 内存使用率超过 85%,持续 5 分钟"
# ---- Redis 拒绝连接(maxclients 打满)----
- alert: SwanLabRedisRejectedConnections
expr: increase(redis_rejected_connections_total{job="swanlab-redis"}[5m]) > 0
for: 1m
labels:
severity: warning
annotations:
summary: "Redis 拒绝了新连接"
description: "instance={{ $labels.instance }} 达到 maxclients,出现被拒绝连接"其中:
<your_namespace>:安装 SwanLab 私有化服务的命名空间<your_storageclass>:存储 Prometheus 指标与 Grafana 配置文件的 StorageClass(PVC)retention.time与retention.size:可观测时序数据的保留时长与轮转存储大小,默认按 7 天 / 15GiB 配置,可按需调整GF_SECURITY_ADMIN_PASSWORD:Grafana 管理员密码,默认为swanlab-monitor@default,建议修改- 抓取配置与告警规则无需额外修改
模板中所有服务的 DNS 地址均以默认 release 名称 swanlab-self-hosted 预设。如果您安装时自行指定了 release 名称(例如 swanlab-my),则完整资源名规则为 <release名>-self-hosted(例如 swanlab-my-self-hosted),对应监控地址需相应调整为 swanlab-my-self-hosted-<服务名>-monitor.<your_namespace>.svc.cluster.local。
替换完对应字段后,安装 Prometheus + Grafana 两个独立 StatefulSet 服务:
kubectl apply -f swanlab-monitor.yaml -n <your_namespace>安装完成后,可通过端口转发验证各抓取任务是否正常:
kubectl port-forward -n <your_namespace> svc/swanlab-monitor-prometheus 9090:9090
# 打开 http://localhost:9090/targets ,确认各 job 的 target 状态为 UP
2.2 「可选」数据库 Exporter 服务安装
针对 Redis / PostgreSQL / ClickHouse 数据库服务,需分别部署对应的 Exporter 服务,用于采集并暴露指标:
数据库 Exporter 模板
# ============================================================
# SwanLab Monitor 组件 — PostgreSQL Exporter(可选,按需安装)
# 查询 pg_stat_* 系统视图,暴露连接数 / 事务 / 锁 / 缓存命中 / 数据库大小等指标,端口 9187
# 占位符:<your_namespace>(命名空间)
# ============================================================

---
# ---------- PostgreSQL Exporter ----------
apiVersion: apps/v1
kind: Deployment
metadata:
  name: swanlab-monitor-postgres-exporter
  namespace: <your_namespace>
  labels:
    app.kubernetes.io/name: postgres-exporter
    app.kubernetes.io/instance: swanlab-monitor
spec:
  replicas: 1
  selector:
    matchLabels:
      app.kubernetes.io/name: postgres-exporter
      app.kubernetes.io/instance: swanlab-monitor
  template:
    metadata:
      labels:
        app.kubernetes.io/name: postgres-exporter
        app.kubernetes.io/instance: swanlab-monitor
    spec:
      containers:
        - name: exporter
          image: repo.swanlab.cn/public/postgres-exporter:v0.17.1
          imagePullPolicy: IfNotPresent
          ports:
            - containerPort: 9187
              name: metrics
          env:
            - name: PG_USER
              valueFrom:
                secretKeyRef:
                  name: swanlab-self-hosted-postgres-credentials # ← 默认 postgres 的 secret 名称
                  key: username
            - name: PG_PASS
              valueFrom:
                secretKeyRef:
                  name: swanlab-self-hosted-postgres-credentials # ← 默认 postgres 的 secret 名称
                  key: password
            - name: DATA_SOURCE_NAME
              value: "postgresql://$(PG_USER):$(PG_PASS)@swanlab-self-hosted-postgres.<your_namespace>.svc.cluster.local:5432/app?sslmode=disable"
          securityContext:
            runAsNonRoot: true
            runAsUser: 65534
            runAsGroup: 65534
            allowPrivilegeEscalation: false
            capabilities:
              drop: ["ALL"]
            readOnlyRootFilesystem: true
          volumeMounts:
            - name: tmp
              mountPath: /tmp
          resources:
            requests:
              cpu: 10m
              memory: 32Mi
            limits:
              cpu: 100m
              memory: 128Mi
      volumes:
        - name: tmp
          emptyDir: {}

---
# ---------- PostgreSQL Exporter Service ----------
apiVersion: v1
kind: Service
metadata:
  name: swanlab-monitor-postgres-exporter
  namespace: <your_namespace>
  labels:
    app.kubernetes.io/name: postgres-exporter
    app.kubernetes.io/instance: swanlab-monitor
spec:
  clusterIP: None
  selector:
    app.kubernetes.io/name: postgres-exporter
    app.kubernetes.io/instance: swanlab-monitor
  ports:
    - port: 9187
      targetPort: metrics
name: metrics# ============================================================
# SwanLab Monitor 组件 — Redis Exporter(可选,按需安装)
# 查询 Redis INFO,暴露内存 / 连接 / 命令统计 / 键空间等指标,端口 9121
# 当前 chart 的 Redis 无密码,仅需配置 REDIS_ADDR
# 占位符:<your_namespace>(命名空间)
# ============================================================
---
# ---------- Redis Exporter ----------
apiVersion: apps/v1
kind: Deployment
metadata:
name: swanlab-monitor-redis-exporter
namespace: <your_namespace>
labels:
app.kubernetes.io/name: redis-exporter
app.kubernetes.io/instance: swanlab-monitor
spec:
replicas: 1
selector:
matchLabels:
app.kubernetes.io/name: redis-exporter
app.kubernetes.io/instance: swanlab-monitor
template:
metadata:
labels:
app.kubernetes.io/name: redis-exporter
app.kubernetes.io/instance: swanlab-monitor
spec:
containers:
- name: exporter
image: repo.swanlab.cn/public/redis-exporter:v1.87.0
imagePullPolicy: IfNotPresent
ports:
- containerPort: 9121
name: metrics
env:
- name: REDIS_ADDR
value: "redis://swanlab-self-hosted-redis.<your_namespace>.svc.cluster.local:6379"
securityContext:
runAsNonRoot: true
runAsUser: 65534
runAsGroup: 65534
allowPrivilegeEscalation: false
capabilities:
drop: ["ALL"]
readOnlyRootFilesystem: true
resources:
requests:
cpu: 10m
memory: 32Mi
limits:
cpu: 100m
memory: 64Mi
---
# ---------- Redis Exporter Service ----------
apiVersion: v1
kind: Service
metadata:
name: swanlab-monitor-redis-exporter
namespace: <your_namespace>
labels:
app.kubernetes.io/name: redis-exporter
app.kubernetes.io/instance: swanlab-monitor
spec:
clusterIP: None
selector:
app.kubernetes.io/name: redis-exporter
app.kubernetes.io/instance: swanlab-monitor
ports:
- port: 9121
targetPort: metrics
name: metrics# ============================================================
# SwanLab Monitor 组件 — ClickHouse Per-Table Exporter(可选,按需安装)
# ClickHouse 内置 exporter 只暴露聚合指标,此服务查询 system.parts
# 暴露每表 bytes / rows / parts 作为 Prometheus gauge 指标,端口 9364
# 占位符:<your_namespace>(命名空间)
# ============================================================
---
# ---------- ClickHouse Per-Table Exporter ----------
apiVersion: apps/v1
kind: Deployment
metadata:
name: swanlab-monitor-ch-table-exporter
namespace: <your_namespace>
labels:
app.kubernetes.io/name: ch-table-exporter
app.kubernetes.io/instance: swanlab-monitor
spec:
replicas: 1
selector:
matchLabels:
app.kubernetes.io/name: ch-table-exporter
app.kubernetes.io/instance: swanlab-monitor
template:
metadata:
labels:
app.kubernetes.io/name: ch-table-exporter
app.kubernetes.io/instance: swanlab-monitor
spec:
containers:
- name: exporter
image: repo.swanlab.cn/public/ch-table-exporter:latest
imagePullPolicy: IfNotPresent
ports:
- containerPort: 9364
name: metrics
env:
- name: CH_HOST
value: "swanlab-self-hosted-clickhouse.<your_namespace>.svc.cluster.local"
- name: CH_PORT
value: "8123"
- name: CLICKHOUSE_USER
valueFrom:
secretKeyRef:
name: swanlab-self-hosted-clickhouse-credentials # ← 默认 clickhouse 的 secret 名称
key: username
- name: CLICKHOUSE_PASSWORD
valueFrom:
secretKeyRef:
name: swanlab-self-hosted-clickhouse-credentials # ← 默认 clickhouse 的 secret 名称
key: password
securityContext:
runAsNonRoot: true
runAsUser: 1000
runAsGroup: 1000
allowPrivilegeEscalation: false
capabilities:
drop: ["ALL"]
readOnlyRootFilesystem: true
resources:
requests:
cpu: 10m
memory: 32Mi
limits:
cpu: 100m
memory: 64Mi
---
# ---------- ClickHouse Per-Table Exporter Service ----------
apiVersion: v1
kind: Service
metadata:
name: swanlab-monitor-ch-table-exporter
namespace: <your_namespace>
labels:
app.kubernetes.io/name: ch-table-exporter
app.kubernetes.io/instance: swanlab-monitor
spec:
clusterIP: None
selector:
app.kubernetes.io/name: ch-table-exporter
app.kubernetes.io/instance: swanlab-monitor
ports:
- port: 9364
targetPort: metrics
name: metricsTIP
模板说明:
- 数据库的 Service 地址与凭据 Secret 名均按默认 release 名称
swanlab-self-hosted预设(Secret 名形如<fullname>-postgres-credentials),如自定义了 release 名称,请按<release名>-self-hosted规则同步调整 PostgreSQL/ClickHouse的 Secret 由 SwanLab chart 自动创建,模板以默认值填充,可通过kubectl get secret -n <your_namespace>确认
确认需要观测的数据库服务后,执行如下命令安装:
# Redis
kubectl apply -f redis-exporter.yaml -n <your_namespace>

# PostgreSQL
kubectl apply -f postgres-exporter.yaml -n <your_namespace>

# ClickHouse
kubectl apply -f clickhouse-exporter.yaml -n <your_namespace>
Exporter 安装完成后,Prometheus 会自动发现新目标并纳入抓取;如需立即生效,可手动重启:
kubectl rollout restart statefulset swanlab-monitor-prometheus -n <your_namespace>

kubectl rollout restart statefulset swanlab-monitor-grafana -n <your_namespace>
3. 配置仪表盘
| 服务 | 看板 JSON 配置模板 |
|---|---|
| SwanLab-Server | Server 监控模板下载 |
| SwanLab-House | House 监控模板下载 |
| SwanLab-Auth | Auth 监控模板下载 |
| Vector | Vector 监控模板下载 |
| Redis | Redis 监控模板下载 |
| PostgreSQL | PostgreSQL 监控模板下载 |
| ClickHouse | ClickHouse 监控模板下载 |
先通过端口转发或者路由配置,以便在浏览器访问 Grafana 看板,例如
kubectl port-forward -n <your_namespace> svc/swanlab-monitor-grafana 3000:80打开 Grafana 前端页面并登录,(默认账号 admin,密码为模板中的 GF_SECURITY_ADMIN_PASSWORD),在 Dashboards → New → Import 中按需导入对应的看板 JSON 配置(数据源选择 Prometheus):
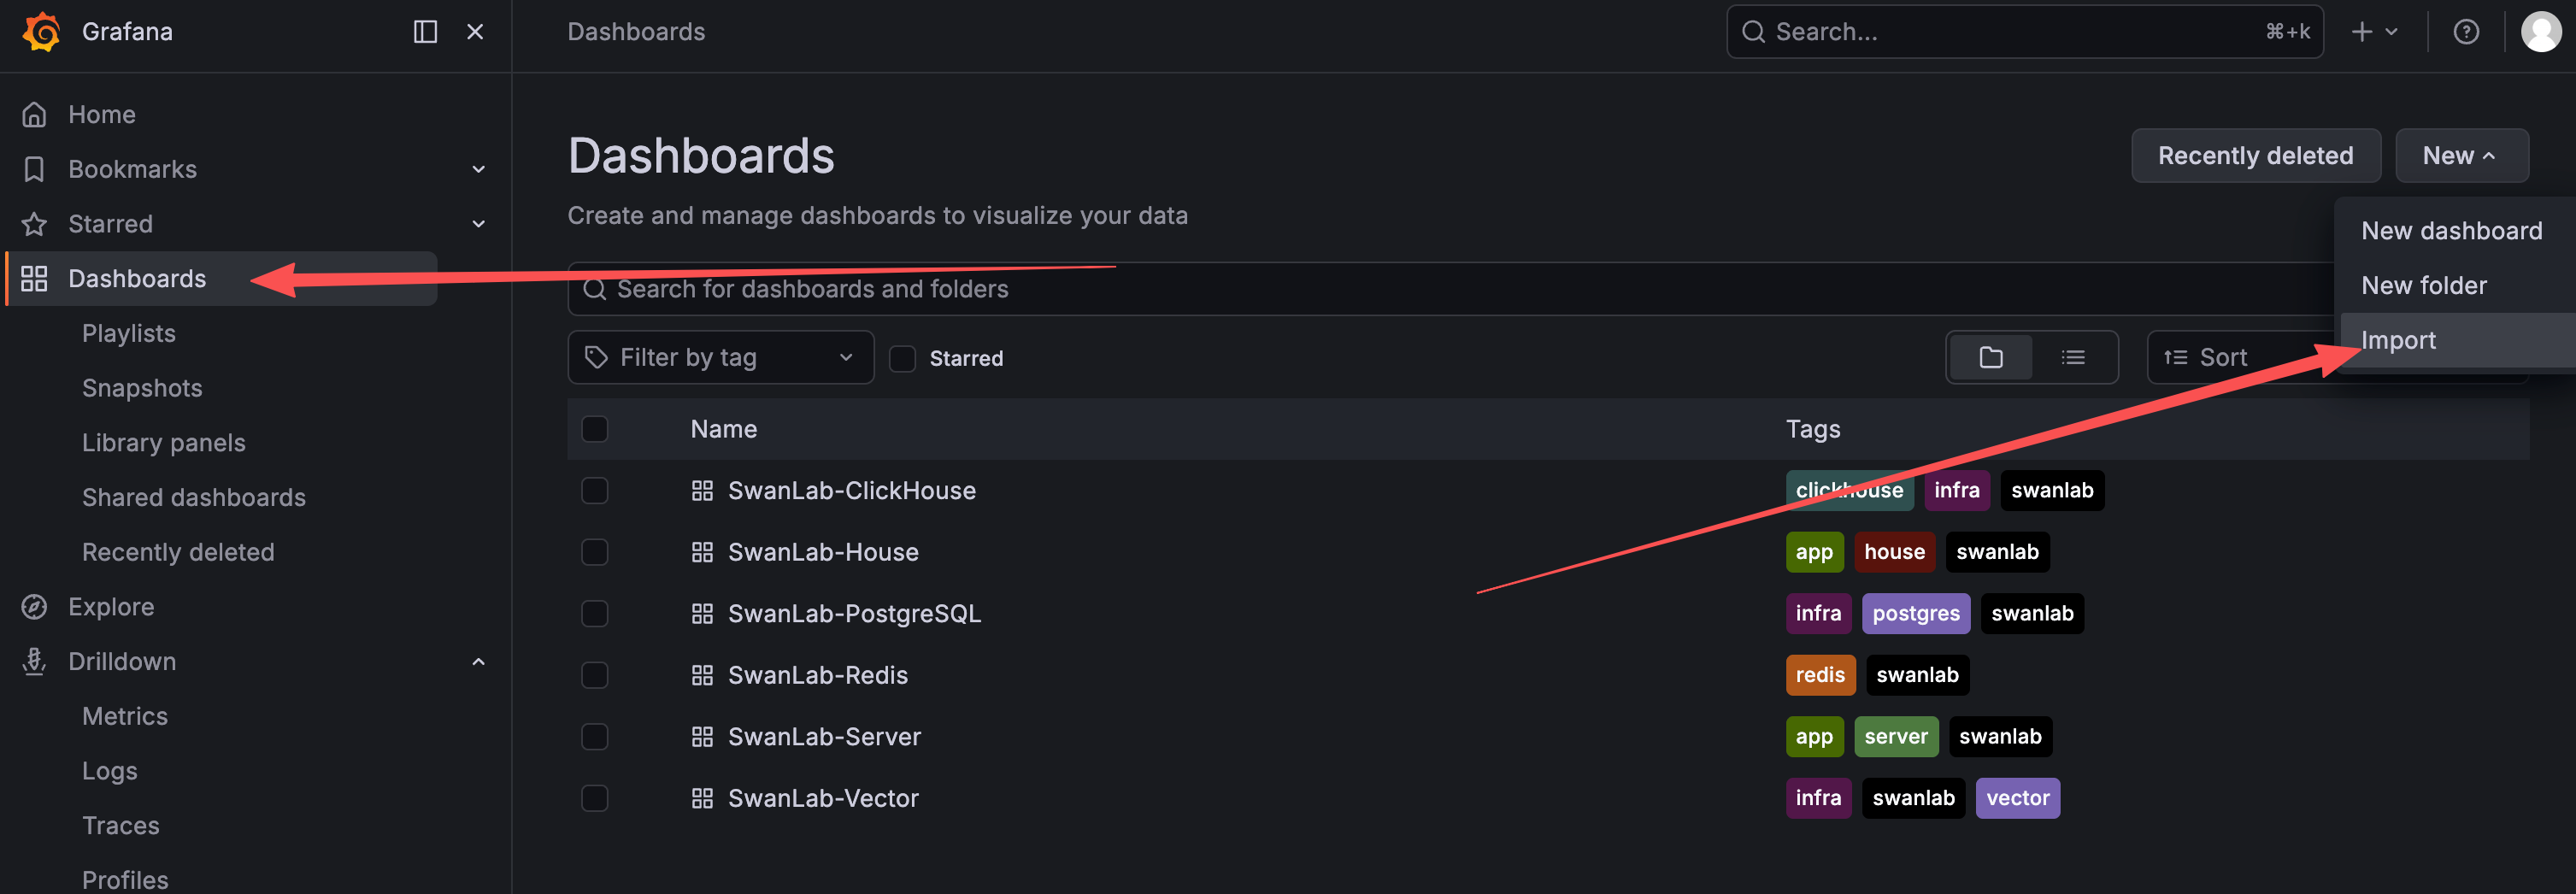
根据配置需求,在本章节最开头下载对应服务的看板 JSON 配置模板,并执行导入 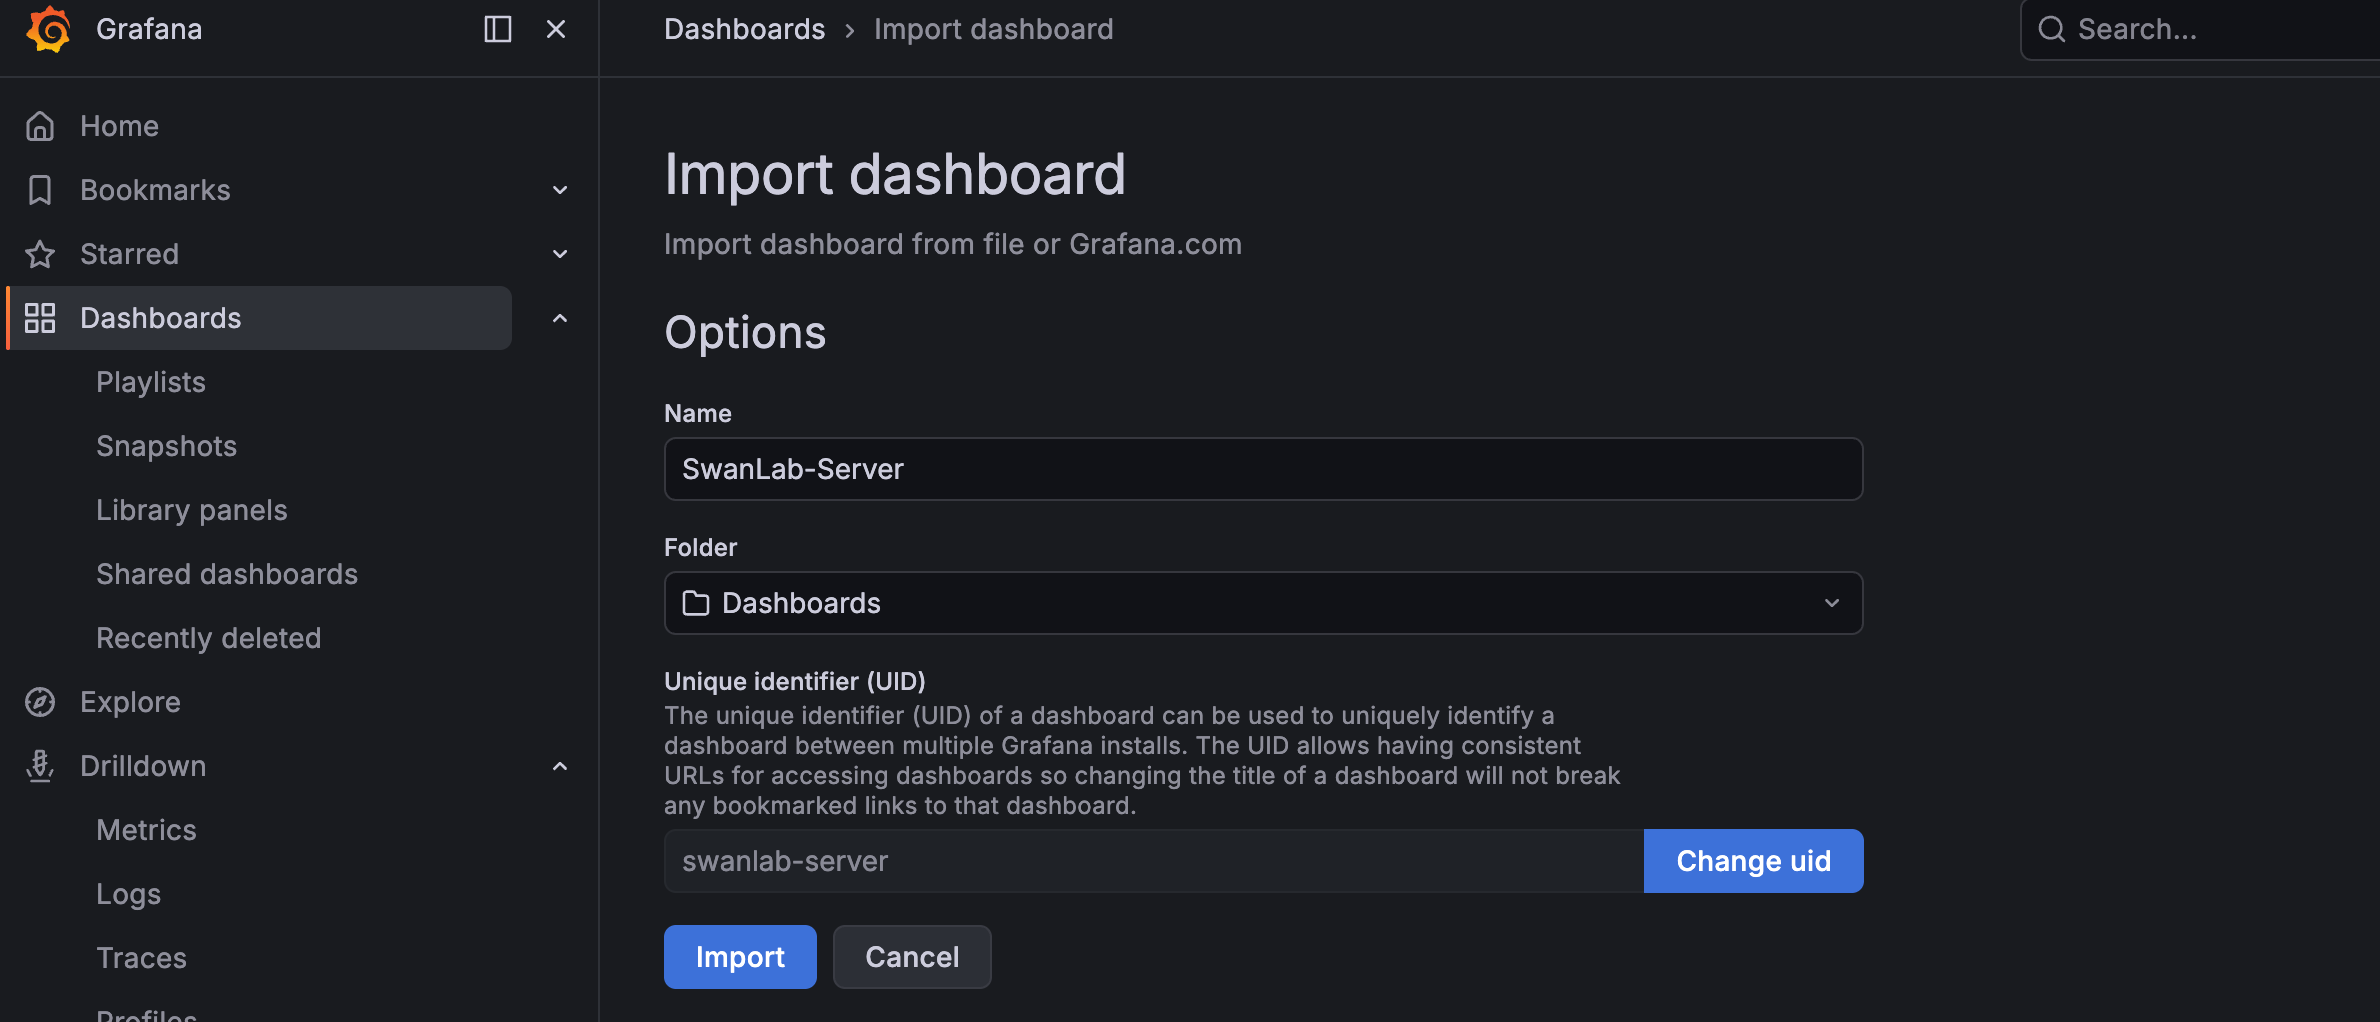
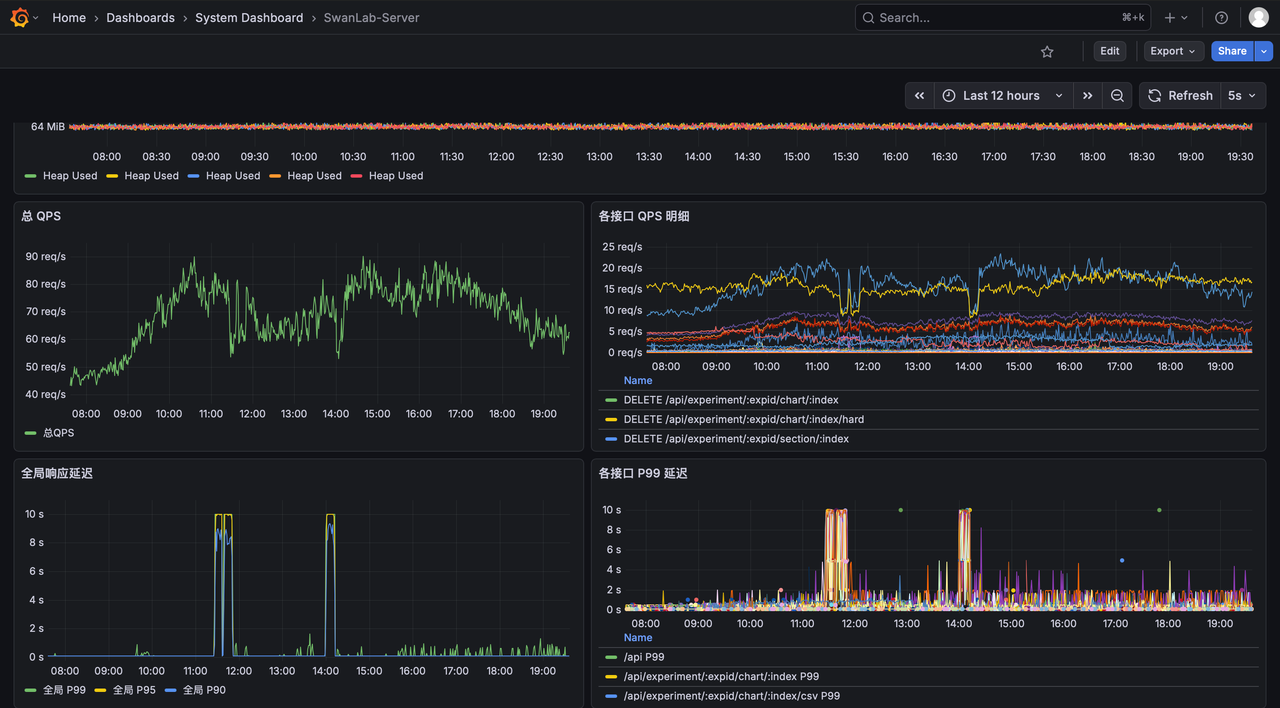
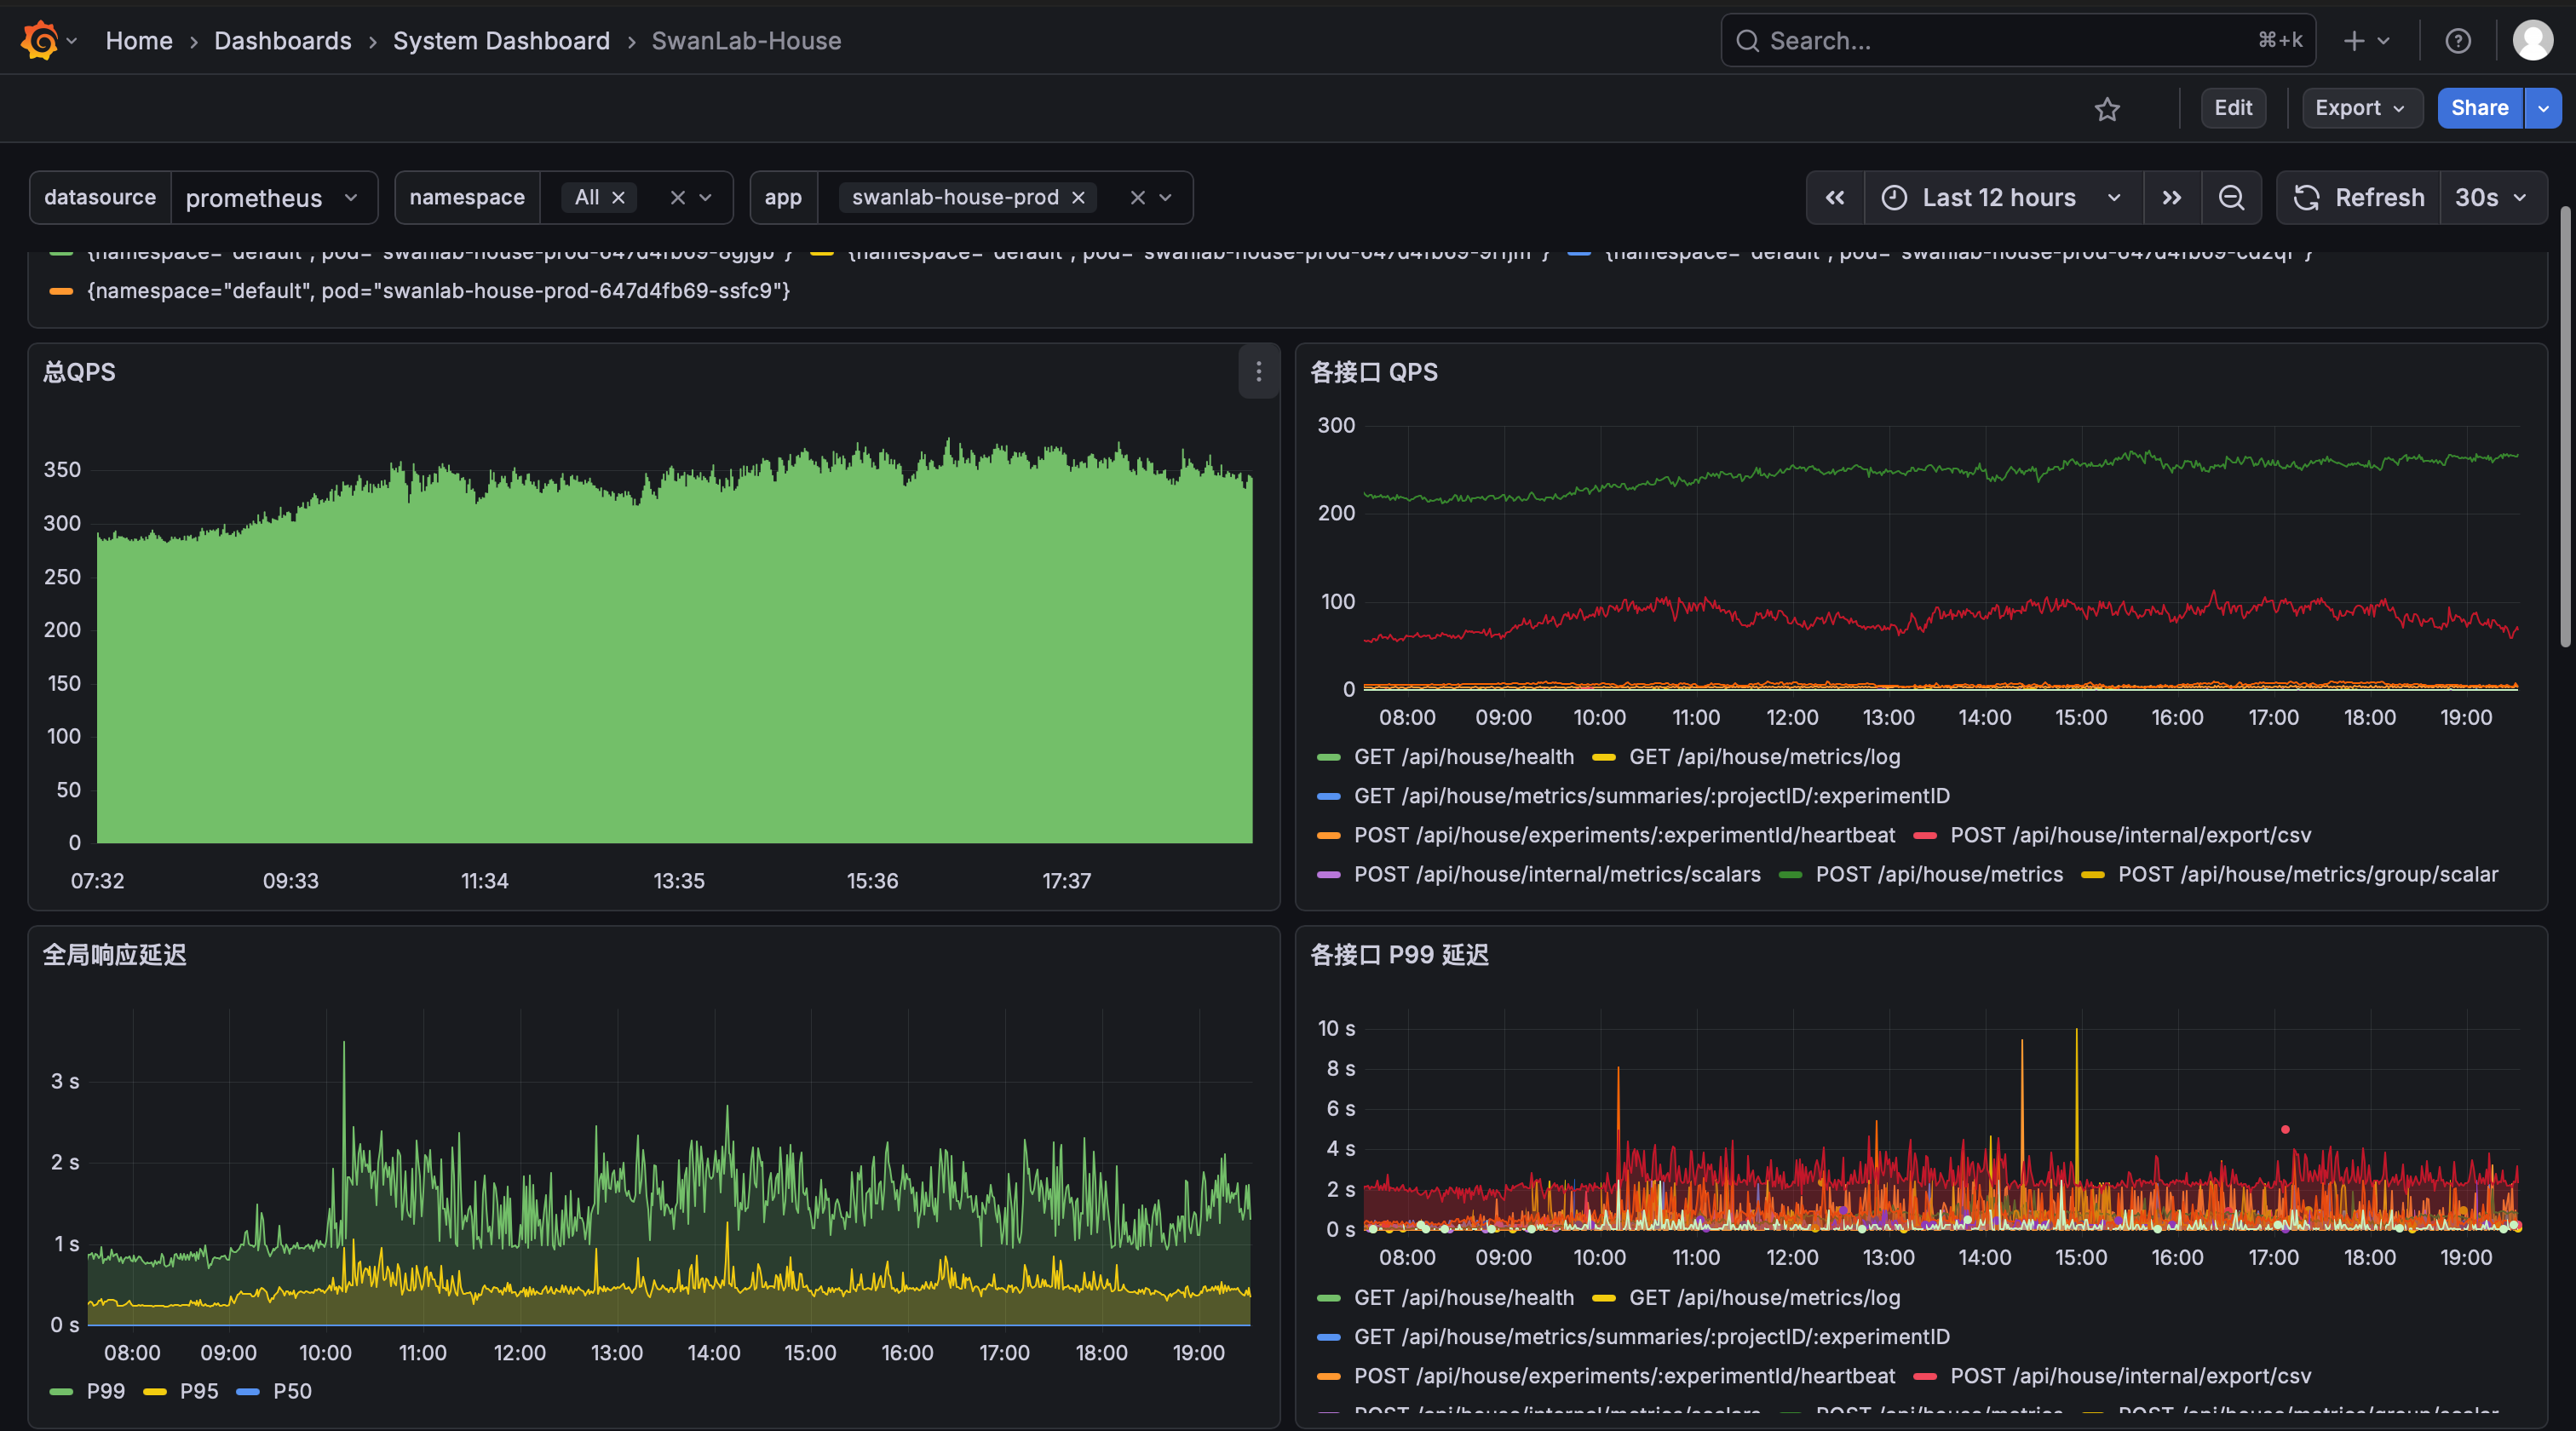
配置正常后可以看到相关的服务监控指标:
SwanLab-Server:
SwanLab-House:
4. 「可选」Alertmanager 告警通知服务
swanlab-monitor.yaml 中已配置服务指标异常时的告警规则阈值,但未配置通知渠道。如需告警触发后自动发送通知,需要额外安装 Alertmanager 及对应的 IM 通道桥接服务。
SwanLab 目前支持以下 4 个 IM 告警通道,按需启用:
| 通道 | 需要填写的占位符 | 说明 |
|---|---|---|
| Slack | <your_slack_token> | Slack Incoming Webhook URL 中 services/ 之后的部分 |
| 飞书 | <your_feishu_webhook_url>、<your_feishu_secret> | 飞书自定义机器人的完整 Webhook URL 与签名校验 secret(未开签名校验可留空) |
| 钉钉 | <your_dingtalk_access_token>、<your_dingtalk_secret> | 钉钉机器人的 access_token 与加签 secret(未开加签可留空) |
| 企业微信 | <your_wecom_bot_key> | 企业微信群机器人 Webhook 的 key 参数 |
所有通道的密钥统一存放在 swanlab-monitor-channels-credentials Secret 中,模板中已预设所有 key,按需填写实际启用的通道即可,未启用的通道保留空值不影响部署。
4.1 Alertmanager 服务安装
swanlab-monitor-alertmanager.yaml 模板
# ============================================================
# SwanLab Monitor — 告警通道统一凭据 Secret
# 所有 IM 通道的密钥集中在此 Secret 中,部署时按需填写一次即可
# ============================================================
apiVersion: v1
kind: Secret
metadata:
  name: swanlab-monitor-channels-credentials
  namespace: <your_namespace>
  labels:
    app.kubernetes.io/name: alertmanager-channels
    app.kubernetes.io/instance: swanlab-monitor
type: Opaque
stringData:
  # ---- Slack(Alertmanager 通过 api_url_file 读取)----
  slack_webhook_url: "https://hooks.slack.com/services/<your_slack_token>"

  # ---- 企业微信(Alertmanager 通过 url_file 读取,含完整 URL + key)----
  wecom_webhook_url: "http://swanlab-monitor-wecom-bridge.<your_namespace>:5001/send?key=<your_wecom_bot_key>"

  # ---- 钉钉(桥通过 subPath 挂载此 key 作为 config.yml)----
  dingtalk_config.yml: |
    targets:
      swanlab:
        url: https://oapi.dingtalk.com/robot/send?access_token=<your_dingtalk_access_token>
        secret: <your_dingtalk_secret> # 未开加签可留空字符串
        mention:
          all: false

  # ---- 飞书(桥通过 envFrom 注入以下环境变量)----
  FEISHU_WEBHOOK_URL: "<your_feishu_webhook_url>"
  FEISHU_SECRET: "<your_feishu_secret>" # 未开签名校验可留空字符串
  MESSAGE_TYPE: "interactive" # interactive=卡片消息,text=纯文本

---
# ---------- Alertmanager 配置 Secret(纯路由配置,无密钥)----------
apiVersion: v1
kind: Secret
metadata:
  name: swanlab-monitor-alertmanager-config
  namespace: <your_namespace>
  labels:
    app.kubernetes.io/name: alertmanager
    app.kubernetes.io/instance: swanlab-monitor
type: Opaque
stringData:
  alertmanager.yml: |
    global:
      resolve_timeout: 5m

    route:
      receiver: im-all
      group_by: ['alertname', 'service', 'namespace']
      group_wait: 30s
      group_interval: 5m
      repeat_interval: 4h

    receivers:
      - name: im-all
        # 通道开关:注释对应配置块即禁用(至少保留一个通道)
        # 密钥不在本文件——统一从 /etc/alertmanager/secrets/ 读取

        # ---- Slack(原生 slack_configs)----
        slack_configs:
          - api_url_file: /etc/alertmanager/secrets/slack_webhook_url
            channel: '#swanlab-alerts' # ← 按实际频道修改
            send_resolved: true

        webhook_configs:
          # ---- 钉钉(需部署 dingtalk.yaml)----
          - url: 'http://swanlab-monitor-dingtalk-bridge.<your_namespace>:8060/dingtalk/swanlab/send'
            send_resolved: true

          # ---- 飞书(需部署 feishu.yaml)----
          - url: 'http://swanlab-monitor-feishu-bridge.<your_namespace>:8080/webhook'
            send_resolved: true

          # ---- 企业微信(需部署 wecom.yaml,URL 含 key,从凭据 Secret 读取)----
          - url_file: /etc/alertmanager/secrets/wecom_webhook_url
            send_resolved: true

---
# ---------- Alertmanager StatefulSet ----------
apiVersion: apps/v1
kind: StatefulSet
metadata:
  name: swanlab-monitor-alertmanager
  namespace: <your_namespace>
  labels:
    app.kubernetes.io/name: alertmanager
    app.kubernetes.io/instance: swanlab-monitor
spec:
  serviceName: swanlab-monitor-alertmanager
  replicas: 1
  updateStrategy:
    type: RollingUpdate
  selector:
    matchLabels:
      app.kubernetes.io/name: alertmanager
      app.kubernetes.io/instance: swanlab-monitor
  template:
    metadata:
      labels:
        app.kubernetes.io/name: alertmanager
        app.kubernetes.io/instance: swanlab-monitor
    spec:
      serviceAccountName: default
      automountServiceAccountToken: false
      securityContext:
        fsGroup: 65534
        runAsUser: 65534
        runAsGroup: 65534
        runAsNonRoot: true
        seccompProfile:
          type: RuntimeDefault
      containers:
        - name: alertmanager
          image: repo.swanlab.cn/public/alertmanager:v0.32.2
          imagePullPolicy: IfNotPresent
          securityContext:
            allowPrivilegeEscalation: false
            capabilities:
              drop: ["ALL"]
            readOnlyRootFilesystem: true
          args:
            - "--config.file=/etc/alertmanager/alertmanager.yml"
            - "--storage.path=/alertmanager"
          ports:
            - name: web
              containerPort: 9093
          volumeMounts:
            - name: config
              mountPath: /etc/alertmanager
              readOnly: true
            - name: secrets # 统一凭据 Secret 挂载(供 api_url_file / url_file 读取)
              mountPath: /etc/alertmanager/secrets
              readOnly: true
            - name: data
              mountPath: /alertmanager
            - name: tmp
              mountPath: /tmp
          readinessProbe:
            httpGet:
              path: /-/ready
              port: web
            initialDelaySeconds: 5
            periodSeconds: 10
          livenessProbe:
            httpGet:
              path: /-/healthy
              port: web
            initialDelaySeconds: 30
            periodSeconds: 30
          resources:
            requests:
              cpu: 100m
              memory: 128Mi
            limits:
              cpu: 300m
              memory: 256Mi
      volumes:
        - name: config
          secret:
            secretName: swanlab-monitor-alertmanager-config
        - name: secrets
          secret:
            secretName: swanlab-monitor-channels-credentials
        - name: tmp
          emptyDir: {}
  volumeClaimTemplates:
    - metadata:
        name: data
      spec:
        accessModes: ["ReadWriteOnce"]
        resources:
          requests:
            storage: 20Gi
        storageClassName: <your_storageclass>
        volumeMode: Filesystem

---
# ---------- Alertmanager Service ----------
apiVersion: v1
kind: Service
metadata:
  name: swanlab-monitor-alertmanager
  namespace: <your_namespace>
  labels:
    app.kubernetes.io/name: alertmanager
    app.kubernetes.io/instance: swanlab-monitor
spec:
  type: ClusterIP
  ports:
    - name: web
      port: 9093
      targetPort: web
  selector:
    app.kubernetes.io/name: alertmanager
    app.kubernetes.io/instance: swanlab-monitor
替换完对应字段后,安装 Alertmanager 服务:
kubectl apply -f swanlab-monitor-alertmanager.yaml -n <your_namespace>4.2 Webhook IM 告警通知配置
根据实际启用的 IM 通道,安装对应的桥接服务(未在 alertmanager.yml 中启用的通道无需安装):
IM 通道桥接模板
# ============================================================
# 钉钉桥 — timonwong/prometheus-webhook-dingtalk,监听 8060
# 密钥(access_token + 加签 secret)从统一凭据 Secret(swanlab-monitor-channels-credentials)读取
# ============================================================

---
# ---------- DingTalk Bridge Deployment ----------
apiVersion: apps/v1
kind: Deployment
metadata:
  name: swanlab-monitor-dingtalk-bridge
  namespace: <your_namespace>
  labels:
    app.kubernetes.io/name: dingtalk-bridge
    app.kubernetes.io/instance: swanlab-monitor
spec:
  replicas: 1
  selector:
    matchLabels:
      app.kubernetes.io/name: dingtalk-bridge
      app.kubernetes.io/instance: swanlab-monitor
  template:
    metadata:
      labels:
        app.kubernetes.io/name: dingtalk-bridge
        app.kubernetes.io/instance: swanlab-monitor
    spec:
      serviceAccountName: default
      automountServiceAccountToken: false
      securityContext:
        runAsNonRoot: true
        runAsUser: 65534
        runAsGroup: 65534
        seccompProfile:
          type: RuntimeDefault
      containers:
        - name: dingtalk-bridge
          image: repo.swanlab.cn/public/prometheus-webhook-dingtalk:v2.1.0
          imagePullPolicy: IfNotPresent
          securityContext:
            allowPrivilegeEscalation: false
            capabilities:
              drop: ["ALL"]
            readOnlyRootFilesystem: true
          args:
            - "--config.file=/etc/prometheus-webhook-dingtalk/config.yml"
            - "--web.listen-address=:8060"
            - "--web.enable-lifecycle"
          ports:
            - name: http
              containerPort: 8060
          volumeMounts:
            - name: credentials # 从统一凭据 Secret 读取 dingtalk_config.yml
              mountPath: /etc/prometheus-webhook-dingtalk
              readOnly: true
            - name: tmp
              mountPath: /tmp
          readinessProbe:
            tcpSocket:
              port: 8060
            initialDelaySeconds: 5
            periodSeconds: 10
          resources:
            requests:
              cpu: 50m
              memory: 32Mi
            limits:
              cpu: 100m
              memory: 64Mi
      volumes:
        - name: credentials # 统一凭据 Secret(dingtalk_config.yml key → config.yml 文件)
          secret:
            secretName: swanlab-monitor-channels-credentials
            items:
              - key: dingtalk_config.yml
                path: config.yml
        - name: tmp
          emptyDir: {}

---
# ---------- DingTalk Bridge Service ----------
apiVersion: v1
kind: Service
metadata:
  name: swanlab-monitor-dingtalk-bridge
  namespace: <your_namespace>
  labels:
    app.kubernetes.io/name: dingtalk-bridge
    app.kubernetes.io/instance: swanlab-monitor
spec:
  type: ClusterIP
  ports:
    - name: http
      port: 8060
      targetPort: http
  selector:
    app.kubernetes.io/name: dingtalk-bridge
app.kubernetes.io/instance: swanlab-monitor# ============================================================
# 飞书桥 — alertmanager-feishu,监听 8080
# 通过 envFrom 从统一凭据 Secret 注入 FEISHU_WEBHOOK_URL / FEISHU_SECRET / MESSAGE_TYPE
# ============================================================
---
# ---------- Feishu Bridge Deployment ----------
apiVersion: apps/v1
kind: Deployment
metadata:
name: swanlab-monitor-feishu-bridge
namespace: <your_namespace>
labels:
app.kubernetes.io/name: feishu-bridge
app.kubernetes.io/instance: swanlab-monitor
spec:
replicas: 1
selector:
matchLabels:
app.kubernetes.io/name: feishu-bridge
app.kubernetes.io/instance: swanlab-monitor
template:
metadata:
labels:
app.kubernetes.io/name: feishu-bridge
app.kubernetes.io/instance: swanlab-monitor
spec:
serviceAccountName: default
automountServiceAccountToken: false
securityContext:
runAsNonRoot: true
runAsUser: 1000
runAsGroup: 1000
seccompProfile:
type: RuntimeDefault
containers:
- name: feishu-bridge
image: repo.swanlab.cn/public/alertmanager-feishu:dev
imagePullPolicy: IfNotPresent
securityContext:
allowPrivilegeEscalation: false
capabilities:
drop: ["ALL"]
readOnlyRootFilesystem: true
command: ["/app/.venv/bin/alertmanager-feishu", "serve"]
envFrom:
- secretRef:
name: swanlab-monitor-channels-credentials
volumeMounts:
- name: tmp
mountPath: /tmp
ports:
- name: http
containerPort: 8080
readinessProbe:
tcpSocket:
port: 8080
initialDelaySeconds: 5
periodSeconds: 10
livenessProbe:
tcpSocket:
port: 8080
initialDelaySeconds: 20
periodSeconds: 30
resources:
requests:
cpu: 100m
memory: 64Mi
limits:
cpu: 200m
memory: 128Mi
volumes:
- name: tmp
emptyDir: {}
---
# ---------- Feishu Bridge Service ----------
apiVersion: v1
kind: Service
metadata:
name: swanlab-monitor-feishu-bridge
namespace: <your_namespace>
labels:
app.kubernetes.io/name: feishu-bridge
app.kubernetes.io/instance: swanlab-monitor
spec:
type: ClusterIP
ports:
- name: http
port: 8080
targetPort: http
selector:
app.kubernetes.io/name: feishu-bridge
app.kubernetes.io/instance: swanlab-monitor# ============================================================
# 企业微信桥 — rea1shane/a2w,监听 5001
# key 在 Alertmanager 的 webhook URL 中配置,桥本身无需凭据
# 如需 @指定用户:在 wecom_webhook_url 后追加 &mention=user1&mention=user2
# 挂载 standard.tmpl 读取标准字段(severity/summary/description),与 Slack/钉钉/飞书统一
# ============================================================
---
# ---------- WeCom Bridge Template ConfigMap ----------
# 自定义模板替代 a2w 内置 base.tmpl(base.tmpl 读 level/current/labels)。
# 本模板读 Alertmanager 通用字段,使 4 个 IM 通道字段一致,rules 无需为企微单独写字段。
apiVersion: v1
kind: ConfigMap
metadata:
name: swanlab-monitor-wecom-bridge-template
namespace: <your_namespace>
labels:
app.kubernetes.io/name: wecom-bridge
app.kubernetes.io/instance: swanlab-monitor
data:
standard.tmpl: |
{{ range $i, $alert := .Alerts }}
{{- if eq $alert.Status "firing" }}
<font color="warning">**[firing] {{ or $alert.Annotations.summary $alert.Labels.alertname }}**</font>
{{- with $alert.Labels.severity }}
**告警等级**: {{ . }}
{{- end }}
**触发时间**: {{ timeFormat ($alert.StartsAt) }}
**持续时长**: {{ timeFromNow ($alert.StartsAt) }}
{{- with $alert.Annotations.description }}
**告警详情**: {{ . }}
{{- end }}
{{- else if eq $alert.Status "resolved" }}
<font color="info">**[resolved] {{ or $alert.Annotations.summary $alert.Labels.alertname }}**</font>
**触发时间**: {{ timeFormat ($alert.StartsAt) }}
**恢复时间**: {{ timeFormat ($alert.EndsAt) }}
**持续时长**: {{ timeDuration ($alert.StartsAt) ($alert.EndsAt) }}
{{- with $alert.Annotations.description }}
**告警详情**: {{ . }}
{{- end }}
{{- end }}
{{- with $alert.GeneratorURL }}
[🔍 Prometheus]({{ . }})
{{- end }}
{{ end }}
---
# ---------- WeCom Bridge Deployment ----------
apiVersion: apps/v1
kind: Deployment
metadata:
name: swanlab-monitor-wecom-bridge
namespace: <your_namespace>
labels:
app.kubernetes.io/name: wecom-bridge
app.kubernetes.io/instance: swanlab-monitor
spec:
replicas: 1
selector:
matchLabels:
app.kubernetes.io/name: wecom-bridge
app.kubernetes.io/instance: swanlab-monitor
template:
metadata:
labels:
app.kubernetes.io/name: wecom-bridge
app.kubernetes.io/instance: swanlab-monitor
spec:
serviceAccountName: default
automountServiceAccountToken: false
securityContext:
runAsNonRoot: true
runAsUser: 65534
runAsGroup: 65534
seccompProfile:
type: RuntimeDefault
containers:
- name: wecom-bridge
image: repo.swanlab.cn/public/a2w:latest
imagePullPolicy: IfNotPresent
args:
- "--template=/etc/a2w/template/standard.tmpl" # 用自定义标准字段模板替代 a2w 内置 base.tmpl
securityContext:
allowPrivilegeEscalation: false
capabilities:
drop: ["ALL"]
readOnlyRootFilesystem: true
env:
- name: TZ
value: Asia/Shanghai # a2w 用本地时区显示告警时间
ports:
- name: http
containerPort: 5001
readinessProbe: # a2w 无标准健康端点,用 tcpSocket 探端口
tcpSocket:
port: 5001
initialDelaySeconds: 5
periodSeconds: 10
livenessProbe:
tcpSocket:
port: 5001
initialDelaySeconds: 20
periodSeconds: 30
resources:
requests:
cpu: 50m
memory: 32Mi
limits:
cpu: 100m
memory: 64Mi
volumeMounts: # 挂载自定义模板(只读)
- name: wecom-template
mountPath: /etc/a2w/template
readOnly: true
volumes: # 自定义模板 ConfigMap
- name: wecom-template
configMap:
name: swanlab-monitor-wecom-bridge-template
---
# ---------- WeCom Bridge Service ----------
apiVersion: v1
kind: Service
metadata:
name: swanlab-monitor-wecom-bridge
namespace: <your_namespace>
labels:
app.kubernetes.io/name: wecom-bridge
app.kubernetes.io/instance: swanlab-monitor
spec:
type: ClusterIP
ports:
- name: http
port: 5001
targetPort: http
selector:
app.kubernetes.io/name: wecom-bridge
app.kubernetes.io/instance: swanlab-monitor按需安装实际启用的通道桥接服务:
# 钉钉
kubectl apply -f dingtalk.yaml -n <your_namespace>

# 飞书
kubectl apply -f feishu.yaml -n <your_namespace>

# 企业微信
kubectl apply -f wecom.yaml -n <your_namespace>
📝 日志接入
日志查看与接入请参考 日志接入指南。
❓ 常见问题
为什么 Metrics 接口返回 404?
最有可能的原因是请求 Method 不对。请确保使用 HTTP GET 访问 metrics 接口。除此之外,请确保访问的服务、端口、路由都是正确的。
Metrics 接口返回的指标分别代表什么?
Metrics 接口遵循 Prometheus 格式规范,通常会返回请求 QPS、请求延迟、请求错误率等信息,同时包含 Node.js、Go 等语言内部运行指标。由于指标数量庞大,Grafana 前端仪表盘仅筛选比较重要的几个指标。 如果有其他可观测指标需求,可以通过前置条件中的验证 Metrics 接口,或者在 Prometheus 面板手动获取所有指标信息进行筛选做进一步分析。
Metrics 接口是否返回了 CPU、内存等指标?
返回,但均为进程级指标。这些指标由 Prometheus 客户端库默认采集,开销极小,且只读取进程自身的 /proc/self 信息,不需要任何额外权限:
- SwanLab-Server(Node.js):
process_cpu_user_seconds_total、process_cpu_system_seconds_total(进程用户态/内核态 CPU 秒数累计值,对其取rate()即为 CPU 用量,单位核)、process_resident_memory_bytes(进程常驻内存 RSS,单位字节)。 - SwanLab-House(Go):
process_cpu_seconds_total(用户态与内核态合计的 CPU 秒数累计值)、process_resident_memory_bytes(常驻内存 RSS)、process_virtual_memory_bytes(虚拟内存)、process_open_fds(打开的文件描述符数),以及go_goroutines、go_memstats_*等 Go 运行时指标。
需要注意的是,这些指标反映的是各服务进程自身的资源占用,不包含节点/宿主机级别的资源指标。在云原生环境中,节点级资源指标通常由 cAdvisor、node-exporter 或云厂商监控组件统一采集,对权限要求较高,如有需要可部署对应组件。
为什么 SwanLab 监控仪表盘中的面板无数据?
CPU、内存等面板的数据来自各服务 Metrics 接口暴露的进程级指标(见上一问),与 QPS、延迟等面板一样由 Prometheus 抓取 SwanLab 服务获得,不依赖额外的硬件监控组件。面板无数据时,建议的排查步骤为:
- 在 Prometheus 面板上查询对应名称的指标是否存在;
- 如果存在,则说明在 Grafana 面板上的指标查询配置存在错误,需要修改 Grafana 面板配置;
- 如果不存在,说明 Prometheus 的抓取任务存在问题,需要排查对应任务。
是否支持监控 Redis、 PostgreSQL、ClickHouse 等基础服务?
支持。PostgreSQL、Redis、ClickHouse 均有对应的 Exporter(例如 postgres_exporter、redis_exporter),可参考上文「2.2 可选数据库 Exporter 服务安装」部署对应的 Exporter 服务,并导入相应的 Grafana 看板,即可观测基础服务指标。