Monitoring & Logging Configuration Guide
This guide describes how to configure
Prometheus + Grafanamonitoring for SwanLab self-hosted services.
INFO
Due to various cluster permission requirements, starting from self-hosted App ≥ 3.0.0, SwanLab adopts a monitoring model with independently deployed Prometheus + Grafana + Alertmanager.
☀️ Architecture Overview
SwanLab self-hosted deployment uses a microservices architecture. Each application service is split by responsibility and runs independently. The overall monitoring pipeline is as follows:
- Prometheus periodically scrapes the
/metricsendpoints exposed by each SwanLab service. - Grafana reads data from Prometheus and renders SwanLab monitoring dashboards and alert panels.
- [Optional] Alertmanager or your existing alerting system sends notifications when Prometheus alert rules trigger.
🪜 Flow Diagram

🧱 Prerequisites
- SwanLab self-hosted service has been installed via Helm (see Kubernetes Deployment Guide)
- You have admin permissions on the namespace where the SwanLab self-hosted service is deployed
- The default
release_nameisswanlab-self-hosted, installed in namespace<your_namespace>, with storage class<your_storageclass>(replace according to your actual setup)
The table below lists the SwanLab services that currently support direct access to metrics, along with their endpoint configuration and routes:
| Service | Description | Port | Path |
|---|---|---|---|
| SwanLab-Server | Core backend business service | 3000 | /metrics |
| SwanLab-House | Experiment metrics OLAP service | 3000 | /metrics |
| Vector | Metrics aggregation & forwarding | 9090 | /metrics |
If base database services such as Redis / PostgreSQL / ClickHouse are not externally integrated, you need to additionally deploy the corresponding Exporter services to forward observability metrics to Prometheus (see Section 2.2 below).
Before configuring Prometheus scrape jobs, it is recommended to first verify that each service's Metrics endpoint is working:
- Verify SwanLab-Server
kubectl exec -n <your_namespace> -c server "$(
  kubectl get pod -n <your_namespace> \
    -l app.kubernetes.io/instance=swanlab-self-hosted,app.kubernetes.io/service=server \
    -o jsonpath='{.items[0].metadata.name}'
)" -- wget -qO- http://127.0.0.1:3000/metrics- Verify SwanLab-House
kubectl exec -n <your_namespace> -c house "$(
  kubectl get pod -n <your_namespace> \
    -l app.kubernetes.io/instance=swanlab-self-hosted,app.kubernetes.io/service=house \
    -o jsonpath='{.items[0].metadata.name}'
)" -- wget -qO- http://127.0.0.1:3000/metrics
Notes:
<release_name>inapp.kubernetes.io/instance=<release_name>is the Helm RELEASE name (defaultswanlab-self-hosted) — replace according to your actual deployment<your_namespace>should be replaced with the actual cluster namespace used for deployment
📊 Observability Monitoring Services
1. Enable monitoring configuration in values
In values.yaml, enable the monitor configuration for services that need observability metrics collection. Example:
# Application services
service:
  server:
    # ...
    # Whether to enable the dedicated Headless Service for monitoring metrics collection
    monitor:
      enable: true
  house:
    # ...
    monitor:
      enable: true

# Vector log aggregation
vector:
  # ...
  monitor:
    enable: true

# Base component services
dependencies:
  # ...
  clickhouse:
    # ...
    # Whether to enable the dedicated Headless Service for monitoring metrics collection
    monitor:
      enable: true
WARNING
The database dependency services under dependencies only take effect when the corresponding service is not externally integrated.
After modifying values.yaml, apply the update:
helm upgrade swanlab-self-hosted <path_to_chart> -n <your_namespace>Once the update completes, each service with monitor enabled will additionally create a standalone monitor Headless Service dedicated to observability metrics collection.
2. Install SwanLab-Monitor standalone monitoring
SwanLab-Monitor bundles the deployment manifests for Prometheus + Grafana along with the observability metrics scrape and alerting configuration. You need to install two single-replica StatefulSet services in the namespace where SwanLab is deployed. The templates are as follows:
2.1 Install the Prometheus + Grafana monitoring services
swanlab-monitor.yaml template
# ============================================================
# SwanLab Monitor — Prometheus + Grafana monitoring stack
# Scrape method: per-Pod scraping via the DNS A records of the dedicated monitoring Headless Service, no K8s API access needed
# Placeholders: <your_namespace> (namespace), <your_storageclass> (StorageClass)
# ============================================================

# ---------- Prometheus ConfigMap ----------
apiVersion: v1
kind: ConfigMap
metadata:
  name: swanlab-monitor-prometheus-config
  namespace: <your_namespace>
  labels:
    app.kubernetes.io/name: prometheus
    app.kubernetes.io/instance: swanlab-monitor
data:
  prometheus.yml: |
    global:
      scrape_interval: 30s
      evaluation_interval: 30s
      external_labels:
        monitor: swanlab-monitor

    scrape_configs:
      # ---- SwanLab Server ----
      # dns_sd discovers all Pod IPs via the A records of the dedicated monitoring Headless Service
      # relabel_configs statically inject the namespace / service labels to match Grafana dashboard variables
      - job_name: "swanlab-server"
        metrics_path: /metrics
        dns_sd_configs:
          - names:
              - swanlab-self-hosted-server-monitor.<your_namespace>.svc.cluster.local
            type: A
            port: 3000
        relabel_configs:
          - target_label: namespace
            replacement: <your_namespace>
          - target_label: service
            replacement: server

      # ---- SwanLab House ----
      - job_name: "swanlab-house"
        metrics_path: /metrics
        dns_sd_configs:
          - names:
              - swanlab-self-hosted-house-monitor.<your_namespace>.svc.cluster.local
            type: A
            port: 3000
        relabel_configs:
          - target_label: namespace
            replacement: <your_namespace>
          - target_label: service
            replacement: house

      # ---- Vector log aggregation (built-in prometheus_exporter, port 9090) ----
      - job_name: "swanlab-vector"
        metrics_path: /metrics
        dns_sd_configs:
          - names:
              - swanlab-self-hosted-vector-monitor.<your_namespace>.svc.cluster.local
            type: A
            port: 9090
        relabel_configs:
          - target_label: namespace
            replacement: <your_namespace>
          - target_label: service
            replacement: vector

      # ---- ClickHouse database (built-in exporter, port 9363, only effective when not externally integrated) ----
      - job_name: "swanlab-clickhouse"
        metrics_path: /metrics
        dns_sd_configs:
          - names:
              - swanlab-self-hosted-clickhouse-monitor.<your_namespace>.svc.cluster.local
            type: A
            port: 9363
        relabel_configs:
          - target_label: namespace
            replacement: <your_namespace>
          - target_label: service
            replacement: clickhouse

      # ---- ClickHouse per-table exporter (port 9364, requires deploying clickhouse-exporter.yaml) ----
      - job_name: "swanlab-clickhouse-tables"
        metrics_path: /metrics
        static_configs:
          - targets:
              - swanlab-monitor-ch-table-exporter.<your_namespace>:9364
        relabel_configs:
          - target_label: namespace
            replacement: <your_namespace>
          - target_label: service
            replacement: clickhouse

      # ---- PostgreSQL exporter (port 9187, requires deploying postgres-exporter.yaml) ----
      - job_name: "swanlab-postgres"
        metrics_path: /metrics
        static_configs:
          - targets:
              - swanlab-monitor-postgres-exporter.<your_namespace>:9187
        relabel_configs:
          - target_label: namespace
            replacement: <your_namespace>
          - target_label: service
            replacement: postgres

      # ---- Redis exporter (port 9121, requires deploying redis-exporter.yaml) ----
      - job_name: "swanlab-redis"
        metrics_path: /metrics
        static_configs:
          - targets:
              - swanlab-monitor-redis-exporter.<your_namespace>:9121
        relabel_configs:
          - target_label: namespace
            replacement: <your_namespace>
          - target_label: service
            replacement: redis

      # ---- Prometheus itself ----
      - job_name: "prometheus"
        static_configs:
          - targets: ["localhost:9090"]

    rule_files:
      - /etc/prometheus/rules/*.yml

    # ---- Integrate with Alertmanager (optional, created by swanlab-monitor-alertmanager.yaml) ----
    alerting:
      alertmanagers:
        - static_configs:
            - targets:
                - swanlab-monitor-alertmanager.<your_namespace>:9093

---
# ---------- Prometheus StatefulSet ----------
apiVersion: apps/v1
kind: StatefulSet
metadata:
  name: swanlab-monitor-prometheus
  namespace: <your_namespace>
  labels:
    app.kubernetes.io/name: prometheus
    app.kubernetes.io/instance: swanlab-monitor
spec:
  serviceName: swanlab-monitor-prometheus
  replicas: 1
  updateStrategy:
    type: RollingUpdate
  selector:
    matchLabels:
      app.kubernetes.io/name: prometheus
      app.kubernetes.io/instance: swanlab-monitor
  template:
    metadata:
      labels:
        app.kubernetes.io/name: prometheus
        app.kubernetes.io/instance: swanlab-monitor
    spec:
      # Explicitly use the default SA + disable automatic token mounting (Prometheus does not need K8s API access)
      serviceAccountName: default
      automountServiceAccountToken: false
      securityContext:
        fsGroup: 65534
        runAsUser: 65534
        runAsGroup: 65534
        runAsNonRoot: true
        seccompProfile:
          type: RuntimeDefault
      containers:
        - name: prometheus
          image: repo.swanlab.cn/public/prometheus:v3.12.0-distroless
          imagePullPolicy: IfNotPresent
          securityContext: # Container-level hardening: no privilege escalation + drop all capabilities + read-only root filesystem
            allowPrivilegeEscalation: false
            capabilities:
              drop: ["ALL"]
            readOnlyRootFilesystem: true
          args:
            - "--config.file=/etc/prometheus/prometheus.yml"
            - "--storage.tsdb.path=/prometheus"
            - "--storage.tsdb.retention.time=7d" # ← adjust retention period as needed (7d/15d/30d, etc.)
            - "--storage.tsdb.retention.size=15GiB" # ← adjust retention size as needed, must not exceed PVC capacity
            - "--web.enable-lifecycle"
          ports:
            - name: web
              containerPort: 9090
          volumeMounts:
            - name: config
              mountPath: /etc/prometheus
              readOnly: true
            - name: rules
              mountPath: /etc/prometheus/rules
              readOnly: true
            - name: data
              mountPath: /prometheus
            - name: tmp # for writing temporary files under a read-only root filesystem
              mountPath: /tmp
          readinessProbe:
            httpGet:
              path: /-/ready
              port: web
            initialDelaySeconds: 10
            periodSeconds: 10
          livenessProbe:
            httpGet:
              path: /-/healthy
              port: web
            initialDelaySeconds: 30
            periodSeconds: 30
          resources:
            requests:
              cpu: "500m"
              memory: "512Mi"
            limits:
              cpu: "1000m"
              memory: "1Gi"
      volumes:
        - name: config
          configMap:
            name: swanlab-monitor-prometheus-config
        - name: rules
          configMap:
            name: swanlab-monitor-prometheus-rules
        - name: tmp
          emptyDir: {}
  volumeClaimTemplates:
    - metadata:
        name: data
      spec:
        accessModes: ["ReadWriteOnce"]
        resources:
          requests:
            storage: "20Gi" # ← adjust storage size as needed
        storageClassName: <your_storageclass> # ← change to the corresponding storageClass in your cluster
        volumeMode: Filesystem

---
# ---------- Prometheus Service ----------
apiVersion: v1
kind: Service
metadata:
  name: swanlab-monitor-prometheus
  namespace: <your_namespace>
  labels:
    app.kubernetes.io/name: prometheus
    app.kubernetes.io/instance: swanlab-monitor
spec:
  type: ClusterIP
  ports:
    - name: web
      port: 9090
      targetPort: web
  selector:
    app.kubernetes.io/name: prometheus
    app.kubernetes.io/instance: swanlab-monitor

---
# ---------- Grafana Datasources ConfigMap ----------
apiVersion: v1
kind: ConfigMap
metadata:
  name: swanlab-monitor-grafana-datasources
  namespace: <your_namespace>
  labels:
    app.kubernetes.io/name: grafana
    app.kubernetes.io/instance: swanlab-monitor
data:
  datasources.yaml: |
    apiVersion: 1
    datasources:
      - name: Prometheus
        type: prometheus
        access: proxy
        url: http://swanlab-monitor-prometheus.<your_namespace>:9090
        isDefault: true
        editable: true

---
# ---------- Grafana StatefulSet ----------
apiVersion: apps/v1
kind: StatefulSet
metadata:
  name: swanlab-monitor-grafana
  namespace: <your_namespace>
  labels:
    app.kubernetes.io/name: grafana
    app.kubernetes.io/instance: swanlab-monitor
spec:
  serviceName: swanlab-monitor-grafana
  replicas: 1
  updateStrategy:
    type: RollingUpdate
  selector:
    matchLabels:
      app.kubernetes.io/name: grafana
      app.kubernetes.io/instance: swanlab-monitor
  template:
    metadata:
      labels:
        app.kubernetes.io/name: grafana
        app.kubernetes.io/instance: swanlab-monitor
    spec:
      serviceAccountName: default
      automountServiceAccountToken: false
      securityContext:
        fsGroup: 472
        runAsNonRoot: true
        runAsUser: 472
        runAsGroup: 472
        seccompProfile:
          type: RuntimeDefault
      containers:
        - name: grafana
          image: repo.swanlab.cn/public/grafana:13.0.1-security-01
          imagePullPolicy: IfNotPresent
          securityContext: # Container-level hardening: no privilege escalation + drop all capabilities + read-only root filesystem
            allowPrivilegeEscalation: false
            capabilities:
              drop: ["ALL"]
            readOnlyRootFilesystem: true
          env:
            - name: GF_SECURITY_ADMIN_PASSWORD
              value: "swanlab-monitor@default" # ← recommend changing the default admin password
            - name: GF_USERS_ALLOW_SIGN_UP
              value: "false"
            - name: GF_SERVER_HTTP_PORT
              value: "3000"
          ports:
            - name: http
              containerPort: 3000
          volumeMounts:
            - name: data
              mountPath: /var/lib/grafana
            - name: provisioning-datasources
              mountPath: /etc/grafana/provisioning/datasources
              readOnly: true
            - name: tmp # for writing temporary files under a read-only root filesystem
              mountPath: /tmp
          readinessProbe:
            httpGet:
              path: /api/health
              port: http
            initialDelaySeconds: 15
            periodSeconds: 10
          livenessProbe:
            httpGet:
              path: /api/health
              port: http
            initialDelaySeconds: 45
            periodSeconds: 30
          resources:
            requests:
              cpu: "500m"
              memory: "512Mi"
            limits:
              cpu: "1"
              memory: "1Gi"
      volumes:
        - name: provisioning-datasources
          configMap:
            name: swanlab-monitor-grafana-datasources
        - name: tmp
          emptyDir: {}
  volumeClaimTemplates:
    - metadata:
        name: data
      spec:
        accessModes: ["ReadWriteOnce"]
        resources:
          requests:
            storage: "20Gi" # ← adjust storage size as needed
        storageClassName: <your_storageclass> # ← change to the corresponding storageClass in your cluster
        volumeMode: Filesystem

---
# ---------- Grafana Service ----------
apiVersion: v1
kind: Service
metadata:
  name: swanlab-monitor-grafana
  namespace: <your_namespace>
  labels:
    app.kubernetes.io/name: grafana
    app.kubernetes.io/instance: swanlab-monitor
spec:
  type: ClusterIP
  ports:
    - name: http
      port: 80
      targetPort: http
  selector:
    app.kubernetes.io/name: grafana
    app.kubernetes.io/instance: swanlab-monitor

---
# ---------- Prometheus Rules ConfigMap ----------
apiVersion: v1
kind: ConfigMap
metadata:
  name: swanlab-monitor-prometheus-rules
  namespace: <your_namespace>
  labels:
    app.kubernetes.io/name: prometheus
    app.kubernetes.io/instance: swanlab-monitor
data:
  swanlab-alerts.yml: |
    # firing alerts are handled by Alertmanager (see swanlab-monitor-alertmanager.yaml), routed to each IM channel by receiver
    groups:
      - name: swanlab-alerts
        interval: 30s
        rules:
          # ---- Scrape health (Server / House) ----
          - alert: SwanLabScrapeDown
            expr: up{job=~"swanlab-(server|house)"} == 0
            for: 5m
            labels:
              severity: critical
            annotations:
              summary: "{{ $labels.job }} scrape failed"
              description: "instance={{ $labels.instance }} has been down for over 5 minutes; Prometheus cannot scrape /metrics"

          # ---- Scrape health (Vector / ClickHouse) ----
          - alert: SwanLabInfraScrapeDown
            expr: up{job=~"swanlab-(vector|clickhouse)"} == 0
            for: 5m
            labels:
              severity: warning
            annotations:
              summary: "{{ $labels.job }} scrape failed"
              description: "instance={{ $labels.instance }} has been down for over 5 minutes; Prometheus cannot scrape /metrics"

          # ---- Server-side 5xx / error rate ----
          - alert: SwanLabHigh5xxRate
            expr: |
              sum by (service, namespace) (
                rate(http_error_requests_total{error_type=~"server_error|exception", route!="/metrics"}[5m])
              )
              /
              sum by (service, namespace) (
                rate(http_requests_total{route!="/metrics"}[5m])
              ) > 0.05
            for: 5m
            labels:
              severity: warning
            annotations:
              summary: "{{ $labels.service }} 5xx error rate too high"
              description: "{{ $labels.service }} server-side error rate exceeds 5% for 5 minutes"

          # ---- panic ----
          - alert: SwanLabPanicSpike
            expr: rate(http_error_requests_total{error_type="exception", route!="/metrics"}[5m]) > 0
            for: 1m
            labels:
              severity: critical
            annotations:
              summary: "{{ $labels.service }} panic detected"
              description: "instance={{ $labels.instance }} experienced a panic in the last 5 minutes (captured by middleware recover)"

          # ---- P99 latency too high ----
          - alert: SwanLabLatencyP99High
            expr: |
              histogram_quantile(0.99,
                sum by (le, service, namespace) (
                  rate(http_request_duration_seconds_bucket{route!="/metrics"}[5m])
                )
              ) > 5
            for: 5m
            labels:
              severity: warning
            annotations:
              summary: "{{ $labels.service }} P99 latency too high"
              description: "{{ $labels.service }} P99 latency exceeds 5s for 5 minutes"

          # ---- Pod frequent restarts ----
          - alert: SwanLabPodRestart
            expr: changes(process_start_time_seconds{job=~"swanlab-(server|house)"}[10m]) > 2
            for: 0m
            labels:
              severity: warning
            annotations:
              summary: "{{ $labels.service }} pod restarting frequently"
              description: "instance={{ $labels.instance }} restarted more than 2 times within 10 minutes"

          # ---- ClickHouse disk usage too high ----
          - alert: SwanLabClickHouseDiskHigh
            expr: |
              ClickHouseAsyncMetrics_DiskUsed_default{job="swanlab-clickhouse"}
              /
              ClickHouseAsyncMetrics_DiskTotal_default{job="swanlab-clickhouse"} > 0.85
            for: 10m
            labels:
              severity: warning
            annotations:
              summary: "ClickHouse disk usage too high"
              description: "instance={{ $labels.instance }} disk usage exceeds 85% for 10 minutes"

          # ---- ClickHouse parts count too high (TooManyParts risk) ----
          - alert: SwanLabClickHouseTooManyParts
            expr: ClickHouseAsyncMetrics_MaxPartCountForPartition{job="swanlab-clickhouse"} > 100
            for: 10m
            labels:
              severity: warning
            annotations:
              summary: "ClickHouse parts count too high"
              description: "instance={{ $labels.instance }} max parts per partition exceeds 100, risk of TooManyParts"

          # ---- Vector disk buffer backlog (usually indicates ClickHouse write consumption falling behind) ----
          - alert: SwanLabVectorDiskBufferBacklog
            expr: |
              (
                vector_buffer_byte_size{buffer_type="disk", job="swanlab-vector"}
                / on (component_id, host)
                vector_buffer_max_byte_size{buffer_type="disk", job="swanlab-vector"}
              ) > 0.5
            for: 10m
            labels:
              severity: warning
            annotations:
              summary: "Vector disk buffer backlog"
              description: "component={{ $labels.component_id }} host={{ $labels.host }} disk buffer usage exceeds 50% for 10 minutes"

          # ---- PostgreSQL down (exporter cannot connect or process abnormal) ----
          - alert: SwanLabPostgresDown
            expr: pg_up{job="swanlab-postgres"} == 0
            for: 1m
            labels:
              severity: critical
            annotations:
              summary: "PostgreSQL down"
              description: "instance={{ $labels.instance }} PostgreSQL unavailable for 1 minute"

          # ---- PostgreSQL connections too high ----
          - alert: SwanLabPostgresConnectionsHigh
            expr: |
              sum(pg_stat_activity_count{job="swanlab-postgres"})
              /
              pg_settings_max_connections{job="swanlab-postgres"} > 0.8
            for: 5m
            labels:
              severity: warning
            annotations:
              summary: "PostgreSQL connections too high"
              description: "active connections exceed 80% of max connections for 5 minutes"

          # ---- PostgreSQL deadlocks (deadlocks is a cumulative counter; rate > 0 means new deadlocks) ----
          - alert: SwanLabPostgresDeadlocks
            expr: rate(pg_stat_database_deadlocks{job="swanlab-postgres"}[5m]) > 0
            for: 1m
            labels:
              severity: warning
            annotations:
              summary: "PostgreSQL deadlocks detected"
              description: "database={{ $labels.datname }} new deadlock occurred"

          # ---- Redis down (exporter cannot connect or process abnormal) ----
          - alert: SwanLabRedisDown
            expr: redis_up{job="swanlab-redis"} == 0
            for: 1m
            labels:
              severity: critical
            annotations:
              summary: "Redis down"
              description: "instance={{ $labels.instance }} Redis unavailable for 1 minute"

          # ---- Redis memory usage too high (auto-skipped when maxmemory=0, i.e. unlimited) ----
          - alert: SwanLabRedisMemoryHigh
            expr: |
              redis_memory_used_bytes{job="swanlab-redis"}
              / redis_memory_max_bytes{job="swanlab-redis"} > 0.85
              and on(instance)
              redis_memory_max_bytes{job="swanlab-redis"} > 0
            for: 5m
            labels:
              severity: warning
            annotations:
              summary: "Redis memory usage too high"
              description: "instance={{ $labels.instance }} memory usage exceeds 85% for 5 minutes"

          # ---- Redis rejected connections (maxclients reached) ----
          - alert: SwanLabRedisRejectedConnections
            expr: increase(redis_rejected_connections_total{job="swanlab-redis"}[5m]) > 0
            for: 1m
            labels:
              severity: warning
            annotations:
              summary: "Redis rejected new connections"
              description: "instance={{ $labels.instance }} reached maxclients, connections rejected"
Where:
<your_namespace>: the namespace where the SwanLab self-hosted service is installed<your_storageclass>: the StorageClass (PVC) for storing Prometheus metrics and Grafana configurationretention.timeandretention.size: the retention period and rotation storage size for observability time-series data, default 7 days / 15GiB, adjust as neededGF_SECURITY_ADMIN_PASSWORD: the Grafana admin password, defaultswanlab-monitor@default, recommended to change- The scrape configuration and alert rules require no additional changes
All service DNS addresses in the template are preset with the default release name swanlab-self-hosted. If you specified a custom release name during installation (e.g. swanlab-my), the full resource name follows the rule <release>-self-hosted (e.g. swanlab-my-self-hosted), and the corresponding monitoring addresses must be adjusted to swanlab-my-self-hosted-<service>-monitor.<your_namespace>.svc.cluster.local.
After replacing the relevant fields, install the two standalone Prometheus + Grafana StatefulSet services:
kubectl apply -f swanlab-monitor.yaml -n <your_namespace>After installation, verify that each scrape job is working via port-forward:
kubectl port-forward -n <your_namespace> svc/swanlab-monitor-prometheus 9090:9090
# Open http://localhost:9090/targets and confirm each job's target status is UP
2.2 [Optional] Install database Exporter services
For the Redis / PostgreSQL / ClickHouse database services, deploy the corresponding Exporter services to collect and expose metrics:
Database Exporter templates
# ============================================================
# SwanLab Monitor component — PostgreSQL Exporter (optional, install as needed)
# Queries pg_stat_* system views, exposing connections / transactions / locks / cache hits / database size, etc., port 9187
# Placeholders: <your_namespace> (namespace)
# ============================================================

---
# ---------- PostgreSQL Exporter ----------
apiVersion: apps/v1
kind: Deployment
metadata:
  name: swanlab-monitor-postgres-exporter
  namespace: <your_namespace>
  labels:
    app.kubernetes.io/name: postgres-exporter
    app.kubernetes.io/instance: swanlab-monitor
spec:
  replicas: 1
  selector:
    matchLabels:
      app.kubernetes.io/name: postgres-exporter
      app.kubernetes.io/instance: swanlab-monitor
  template:
    metadata:
      labels:
        app.kubernetes.io/name: postgres-exporter
        app.kubernetes.io/instance: swanlab-monitor
    spec:
      containers:
        - name: exporter
          image: repo.swanlab.cn/public/postgres-exporter:v0.17.1
          imagePullPolicy: IfNotPresent
          ports:
            - containerPort: 9187
              name: metrics
          env:
            - name: PG_USER
              valueFrom:
                secretKeyRef:
                  name: swanlab-self-hosted-postgres-credentials # ← default postgres secret name
                  key: username
            - name: PG_PASS
              valueFrom:
                secretKeyRef:
                  name: swanlab-self-hosted-postgres-credentials # ← default postgres secret name
                  key: password
            - name: DATA_SOURCE_NAME
              value: "postgresql://$(PG_USER):$(PG_PASS)@swanlab-self-hosted-postgres.<your_namespace>.svc.cluster.local:5432/app?sslmode=disable"
          securityContext:
            runAsNonRoot: true
            runAsUser: 65534
            runAsGroup: 65534
            allowPrivilegeEscalation: false
            capabilities:
              drop: ["ALL"]
            readOnlyRootFilesystem: true
          volumeMounts:
            - name: tmp
              mountPath: /tmp
          resources:
            requests:
              cpu: 10m
              memory: 32Mi
            limits:
              cpu: 100m
              memory: 128Mi
      volumes:
        - name: tmp
          emptyDir: {}

---
# ---------- PostgreSQL Exporter Service ----------
apiVersion: v1
kind: Service
metadata:
  name: swanlab-monitor-postgres-exporter
  namespace: <your_namespace>
  labels:
    app.kubernetes.io/name: postgres-exporter
    app.kubernetes.io/instance: swanlab-monitor
spec:
  clusterIP: None
  selector:
    app.kubernetes.io/name: postgres-exporter
    app.kubernetes.io/instance: swanlab-monitor
  ports:
    - port: 9187
      targetPort: metrics
name: metrics# ============================================================
# SwanLab Monitor component — Redis Exporter (optional, install as needed)
# Queries Redis INFO, exposing memory / connections / command stats / keyspace, etc., port 9121
# The current chart's Redis has no password, so only REDIS_ADDR is needed
# Placeholders: <your_namespace> (namespace)
# ============================================================
---
# ---------- Redis Exporter ----------
apiVersion: apps/v1
kind: Deployment
metadata:
name: swanlab-monitor-redis-exporter
namespace: <your_namespace>
labels:
app.kubernetes.io/name: redis-exporter
app.kubernetes.io/instance: swanlab-monitor
spec:
replicas: 1
selector:
matchLabels:
app.kubernetes.io/name: redis-exporter
app.kubernetes.io/instance: swanlab-monitor
template:
metadata:
labels:
app.kubernetes.io/name: redis-exporter
app.kubernetes.io/instance: swanlab-monitor
spec:
containers:
- name: exporter
image: repo.swanlab.cn/public/redis-exporter:v1.87.0
imagePullPolicy: IfNotPresent
ports:
- containerPort: 9121
name: metrics
env:
- name: REDIS_ADDR
value: "redis://swanlab-self-hosted-redis.<your_namespace>.svc.cluster.local:6379"
securityContext:
runAsNonRoot: true
runAsUser: 65534
runAsGroup: 65534
allowPrivilegeEscalation: false
capabilities:
drop: ["ALL"]
readOnlyRootFilesystem: true
resources:
requests:
cpu: 10m
memory: 32Mi
limits:
cpu: 100m
memory: 64Mi
---
# ---------- Redis Exporter Service ----------
apiVersion: v1
kind: Service
metadata:
name: swanlab-monitor-redis-exporter
namespace: <your_namespace>
labels:
app.kubernetes.io/name: redis-exporter
app.kubernetes.io/instance: swanlab-monitor
spec:
clusterIP: None
selector:
app.kubernetes.io/name: redis-exporter
app.kubernetes.io/instance: swanlab-monitor
ports:
- port: 9121
targetPort: metrics
name: metrics# ============================================================
# SwanLab Monitor component — ClickHouse Per-Table Exporter (optional, install as needed)
# ClickHouse's built-in exporter only exposes aggregated metrics; this service queries system.parts
# and exposes per-table bytes / rows / parts as Prometheus gauge metrics, port 9364
# Placeholders: <your_namespace> (namespace)
# ============================================================
---
# ---------- ClickHouse Per-Table Exporter ----------
apiVersion: apps/v1
kind: Deployment
metadata:
name: swanlab-monitor-ch-table-exporter
namespace: <your_namespace>
labels:
app.kubernetes.io/name: ch-table-exporter
app.kubernetes.io/instance: swanlab-monitor
spec:
replicas: 1
selector:
matchLabels:
app.kubernetes.io/name: ch-table-exporter
app.kubernetes.io/instance: swanlab-monitor
template:
metadata:
labels:
app.kubernetes.io/name: ch-table-exporter
app.kubernetes.io/instance: swanlab-monitor
spec:
containers:
- name: exporter
image: repo.swanlab.cn/public/ch-table-exporter:latest
imagePullPolicy: IfNotPresent
ports:
- containerPort: 9364
name: metrics
env:
- name: CH_HOST
value: "swanlab-self-hosted-clickhouse.<your_namespace>.svc.cluster.local"
- name: CH_PORT
value: "8123"
- name: CLICKHOUSE_USER
valueFrom:
secretKeyRef:
name: swanlab-self-hosted-clickhouse-credentials # ← default clickhouse secret name
key: username
- name: CLICKHOUSE_PASSWORD
valueFrom:
secretKeyRef:
name: swanlab-self-hosted-clickhouse-credentials # ← default clickhouse secret name
key: password
securityContext:
runAsNonRoot: true
runAsUser: 1000
runAsGroup: 1000
allowPrivilegeEscalation: false
capabilities:
drop: ["ALL"]
readOnlyRootFilesystem: true
resources:
requests:
cpu: 10m
memory: 32Mi
limits:
cpu: 100m
memory: 64Mi
---
# ---------- ClickHouse Per-Table Exporter Service ----------
apiVersion: v1
kind: Service
metadata:
name: swanlab-monitor-ch-table-exporter
namespace: <your_namespace>
labels:
app.kubernetes.io/name: ch-table-exporter
app.kubernetes.io/instance: swanlab-monitor
spec:
clusterIP: None
selector:
app.kubernetes.io/name: ch-table-exporter
app.kubernetes.io/instance: swanlab-monitor
ports:
- port: 9364
targetPort: metrics
name: metricsTIP
Template notes:
- The database Service addresses and credential Secret names are all preset with the default release name
swanlab-self-hosted(Secret names in the form<fullname>-postgres-credentials); if you customized the release name, adjust according to the<release>-self-hostedrule - The
PostgreSQL/ClickHouseSecrets are auto-created by the SwanLab chart; the templates are filled with default values — verify viakubectl get secret -n <your_namespace>
After confirming which database services you want to observe, run the following commands to install them:
# Redis
kubectl apply -f redis-exporter.yaml -n <your_namespace>

# PostgreSQL
kubectl apply -f postgres-exporter.yaml -n <your_namespace>

# ClickHouse
kubectl apply -f clickhouse-exporter.yaml -n <your_namespace>
After the Exporters are installed, Prometheus automatically discovers the new targets and includes them in scraping; to take effect immediately, restart manually:
kubectl rollout restart statefulset swanlab-monitor-prometheus -n <your_namespace>

kubectl rollout restart statefulset swanlab-monitor-grafana -n <your_namespace>
3. Configure dashboards
| Service | Dashboard JSON template |
|---|---|
| SwanLab-Server | Download Server dashboard template |
| SwanLab-House | Download House dashboard template |
| Vector | Download Vector dashboard template |
| Redis | Download Redis dashboard template |
| PostgreSQL | Download PostgreSQL dashboard template |
| ClickHouse | Download ClickHouse dashboard template |
First set up port-forwarding or route configuration so you can access the Grafana dashboard in a browser, for example:
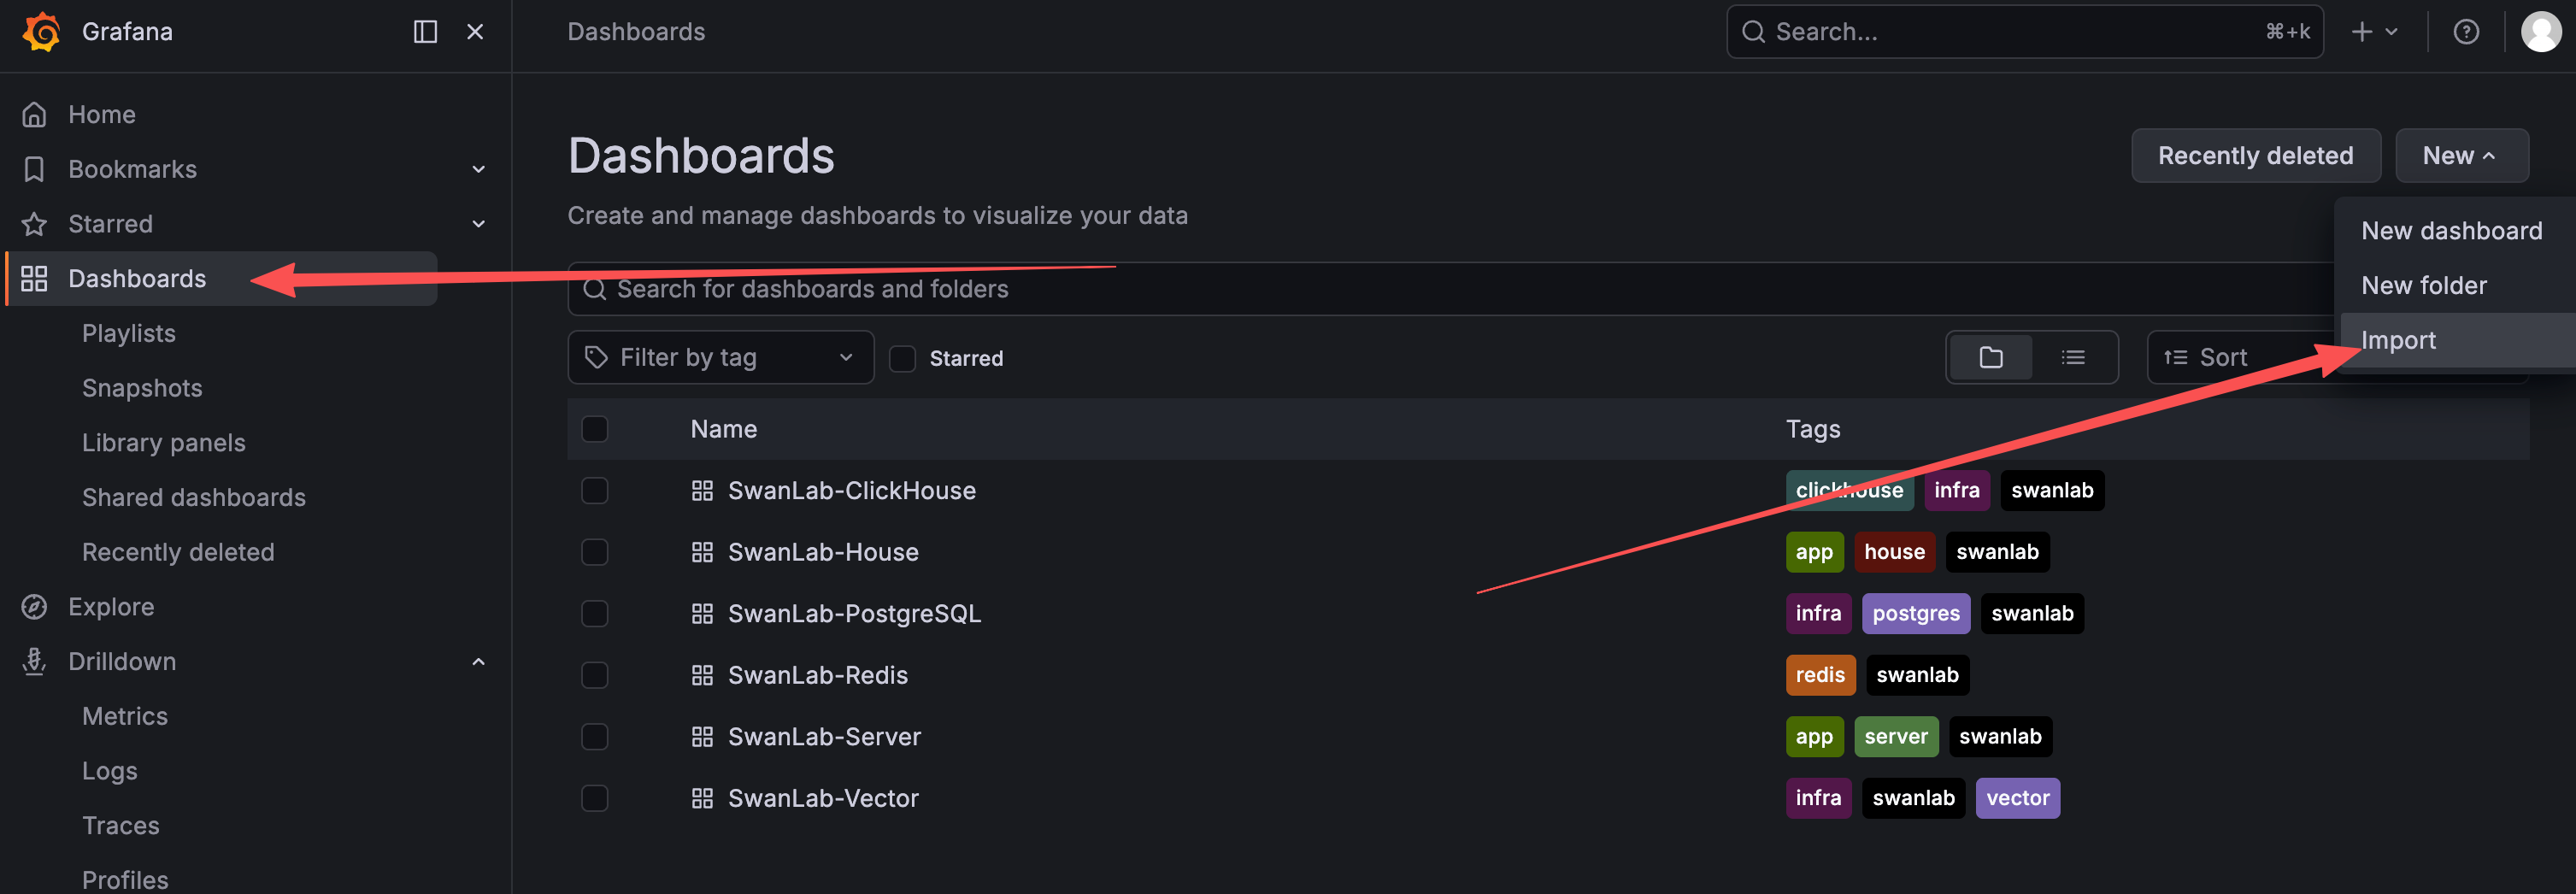
kubectl port-forward -n <your_namespace> svc/swanlab-monitor-grafana 3000:80Open the Grafana frontend and log in (default account admin, password is the GF_SECURITY_ADMIN_PASSWORD in the template). In Dashboards → New → Import, import the corresponding dashboard JSON as needed (select Prometheus as the data source):
Download the dashboard JSON template for the corresponding service from the beginning of this section, then import it: 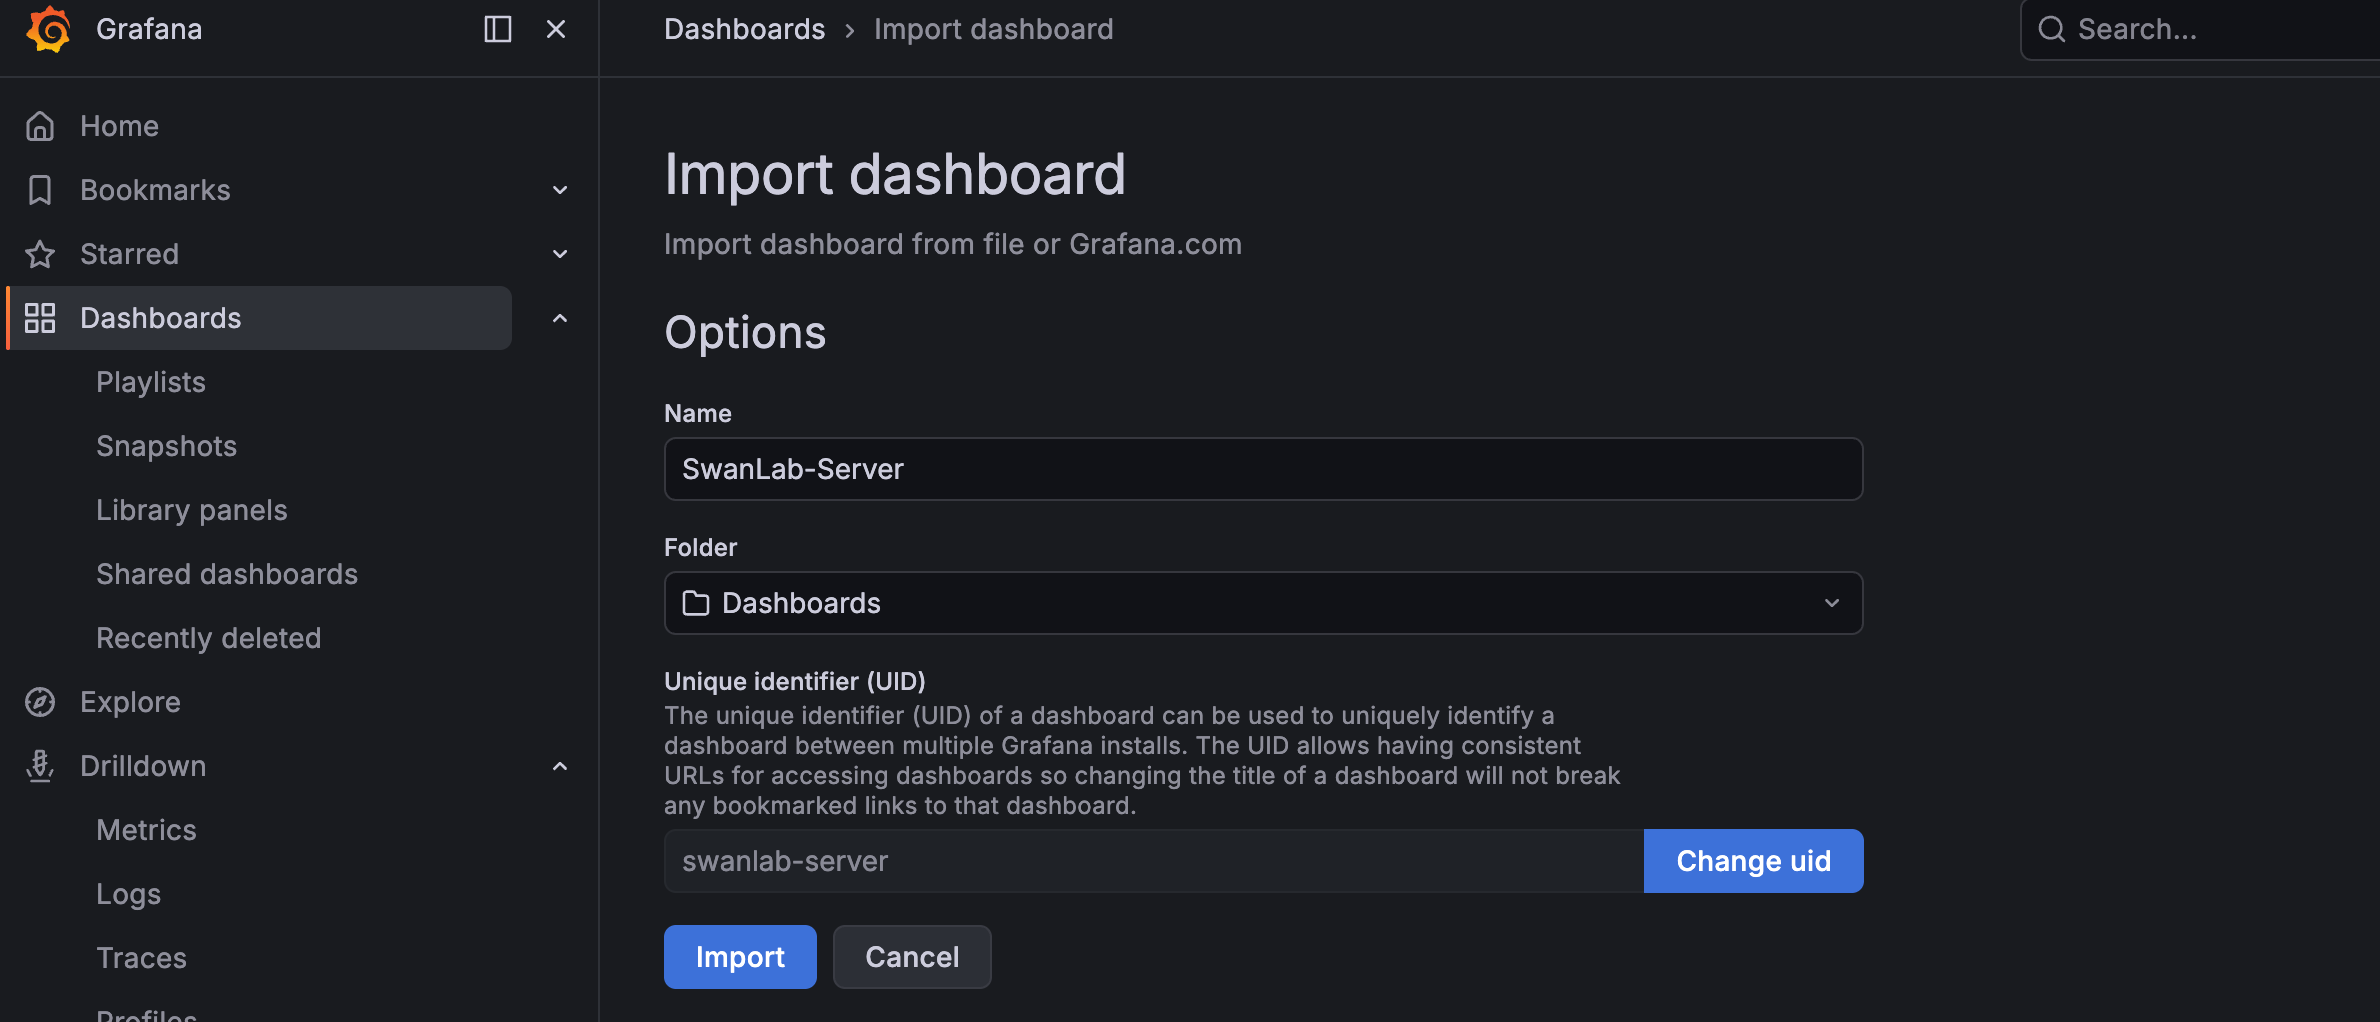
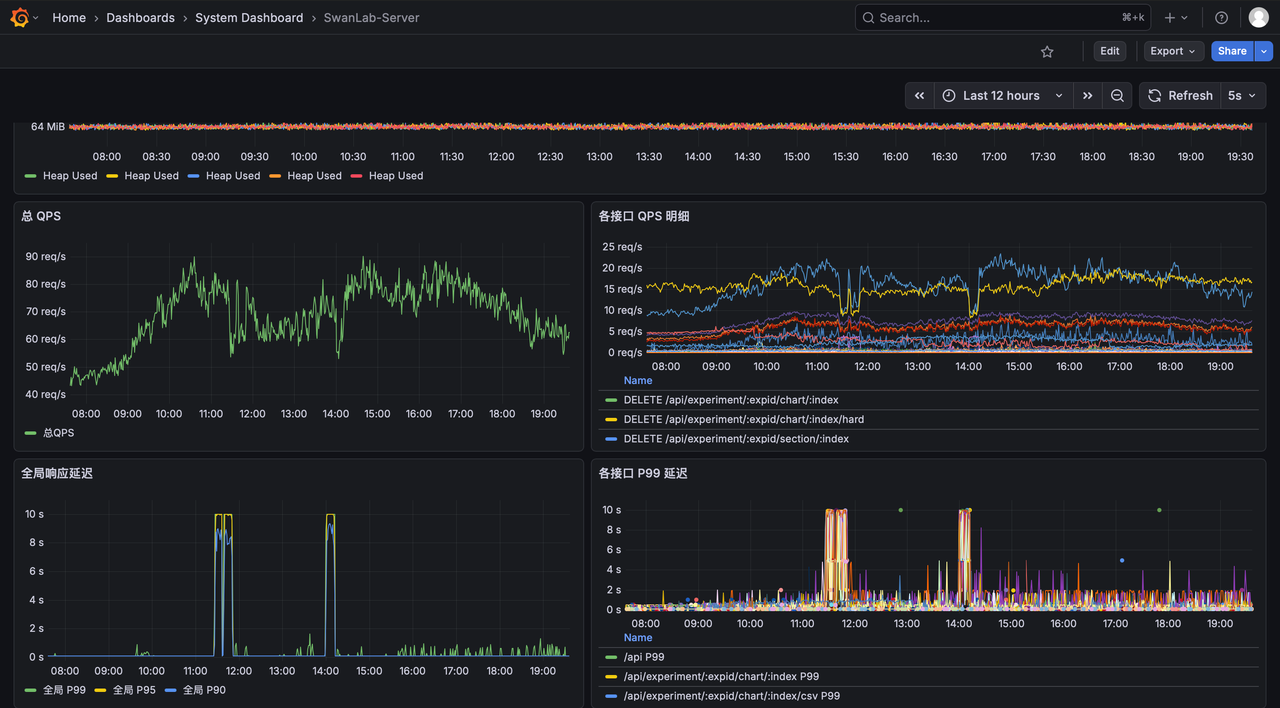
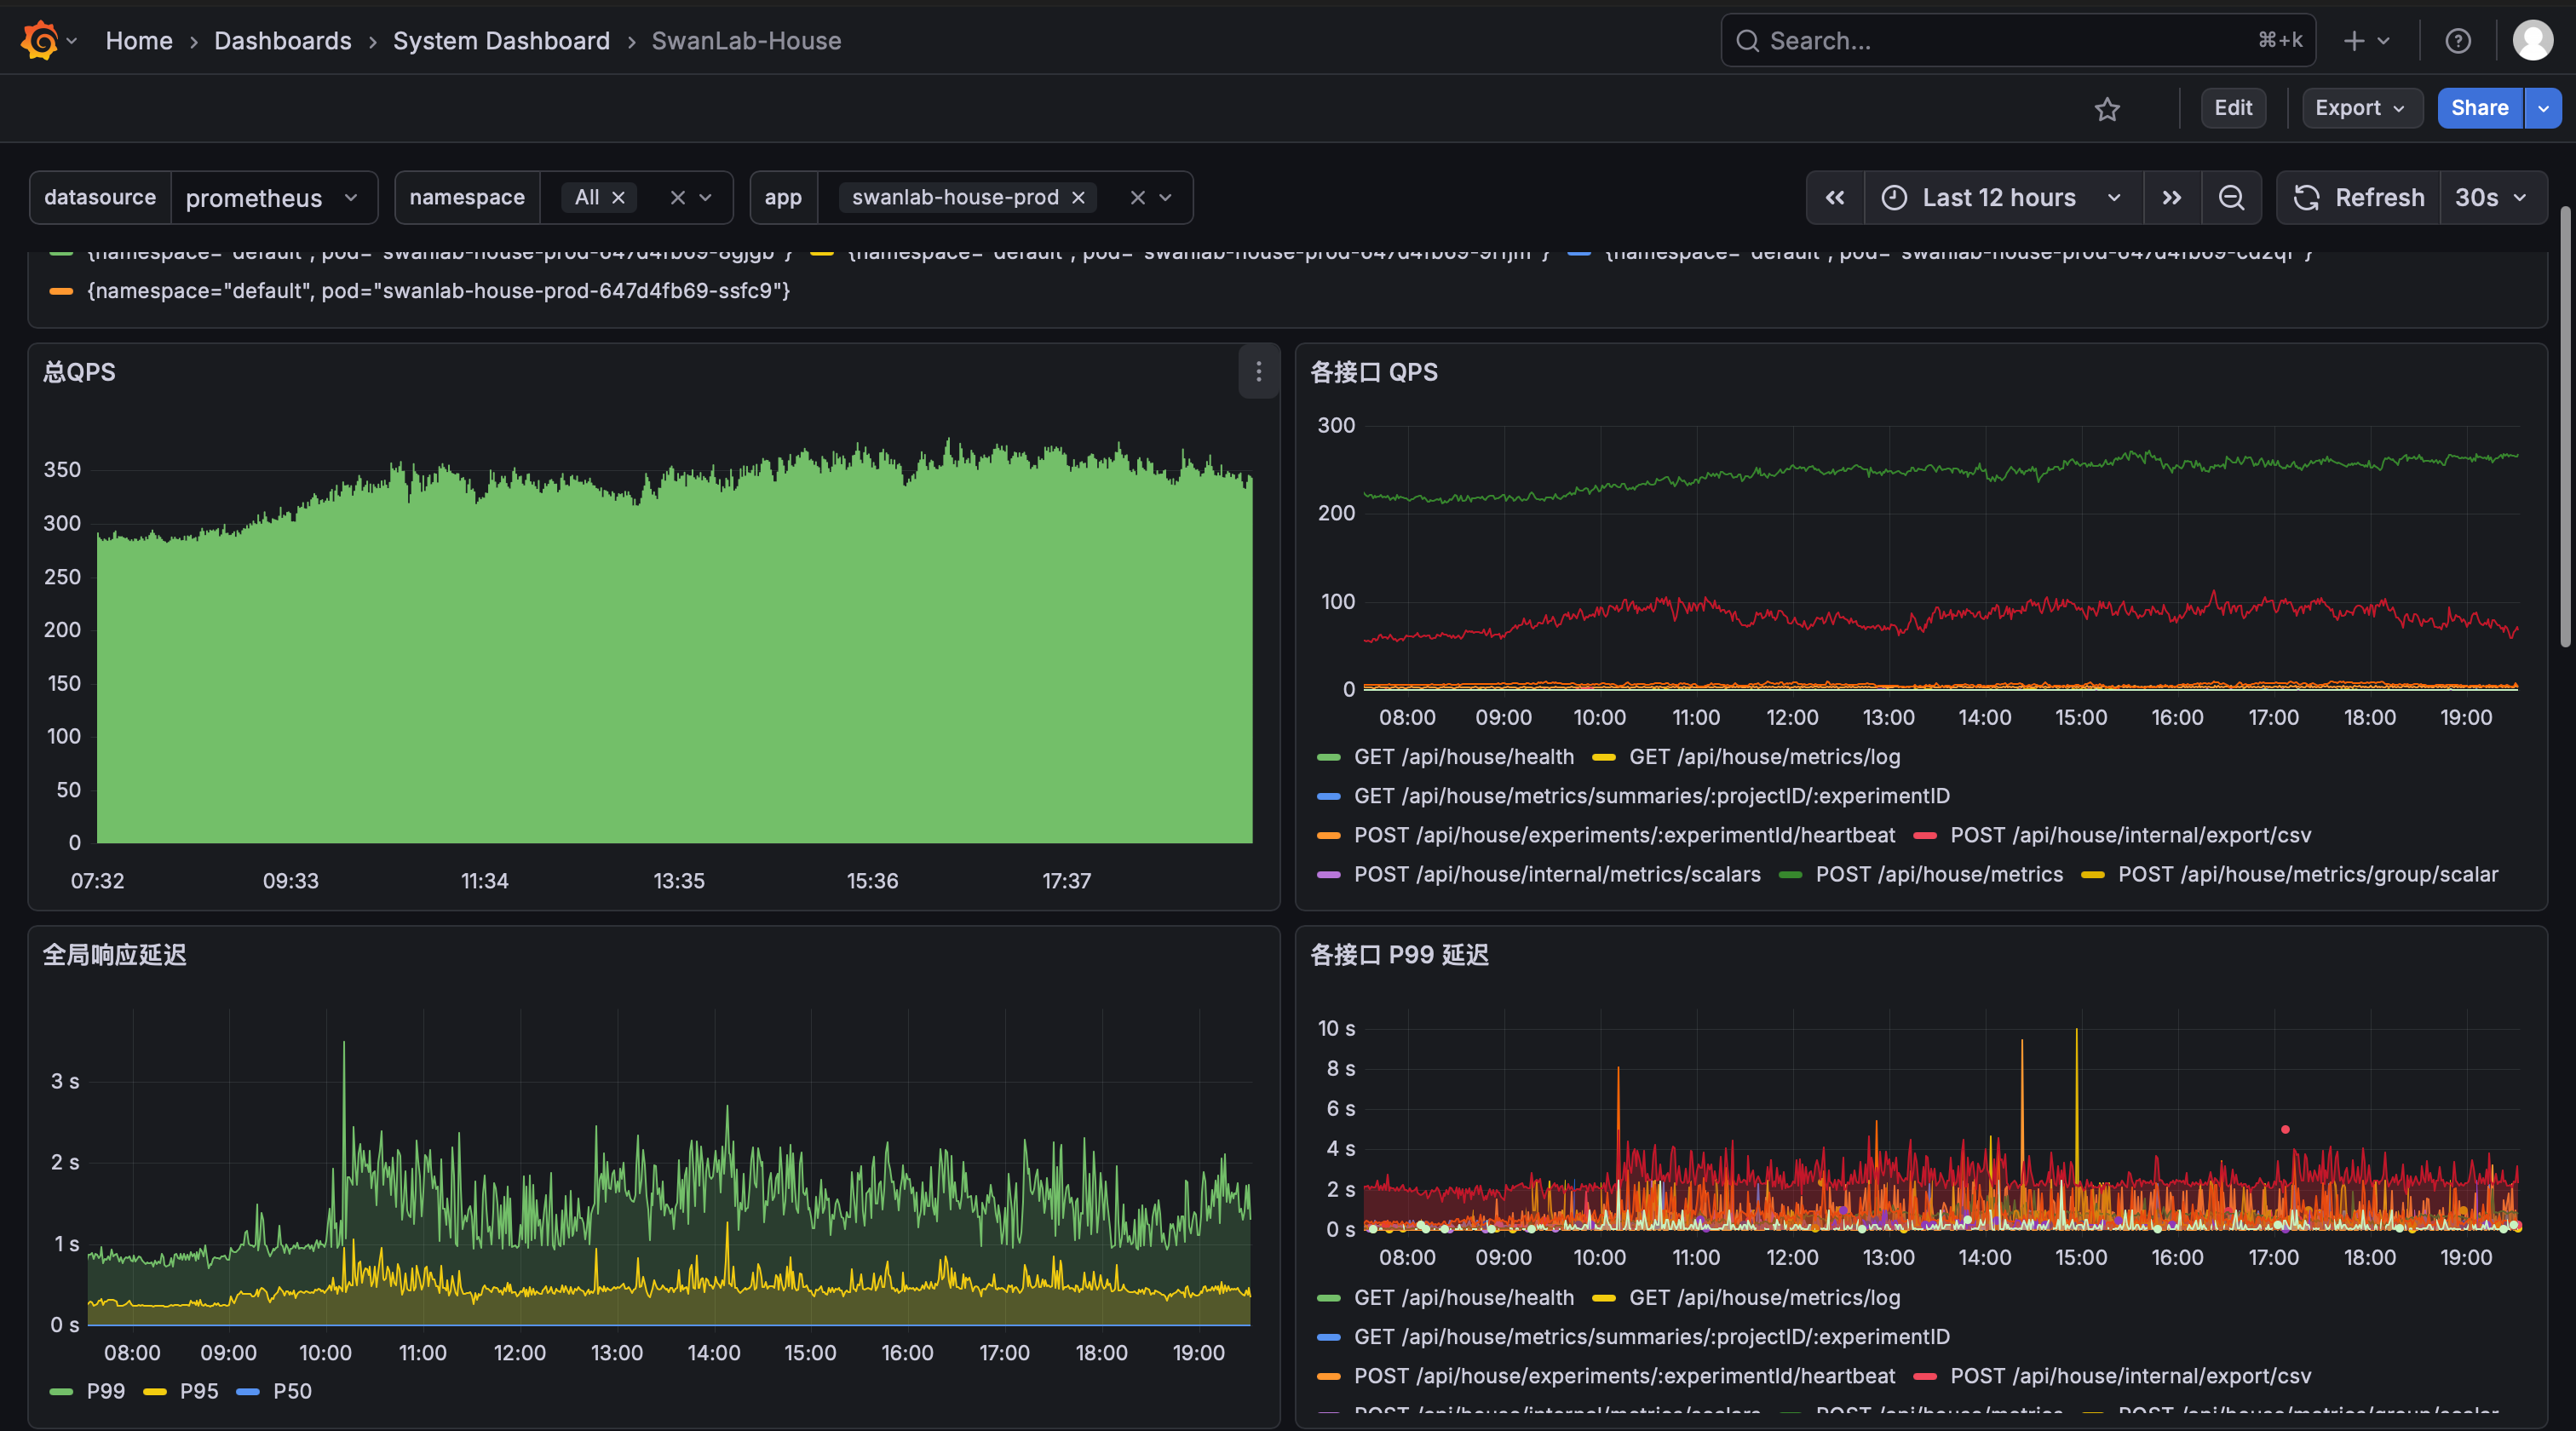
Once configured correctly, you can see the related service monitoring metrics:
SwanLab-Server:
SwanLab-House:
4. [Optional] Alertmanager alert notification service
swanlab-monitor.yaml already configures alert rule thresholds for abnormal service metrics, but does not configure notification channels. To automatically send notifications after alerts trigger, you need to additionally install Alertmanager and the corresponding IM channel bridge services.
SwanLab currently supports the following 4 IM alert channels, enable them as needed:
| Channel | Placeholders to fill | Description |
|---|---|---|
| Slack | <your_slack_token> | The part after services/ in the Slack Incoming Webhook URL |
| Feishu | <your_feishu_webhook_url>, <your_feishu_secret> | The full Webhook URL of the Feishu custom bot and its signature verification secret (leave empty if signature verification is disabled) |
| DingTalk | <your_dingtalk_access_token>, <your_dingtalk_secret> | The DingTalk bot's access_token and signing secret (leave empty if signing is disabled) |
| WeCom | <your_wecom_bot_key> | The key parameter of the WeCom group bot Webhook |
All channel secrets are stored together in the swanlab-monitor-channels-credentials Secret. The template presets all keys — just fill in the channels you actually enable; unused channels can keep empty values without affecting deployment.
4.1 Install the Alertmanager service
swanlab-monitor-alertmanager.yaml template
# ============================================================
# SwanLab Monitor — unified alert channel credentials Secret
# All IM channel secrets are centralized in this Secret; fill them in once, as needed, during deployment
# ============================================================
apiVersion: v1
kind: Secret
metadata:
  name: swanlab-monitor-channels-credentials
  namespace: <your_namespace>
  labels:
    app.kubernetes.io/name: alertmanager-channels
    app.kubernetes.io/instance: swanlab-monitor
type: Opaque
stringData:
  # ---- Slack (Alertmanager reads via api_url_file) ----
  slack_webhook_url: "https://hooks.slack.com/services/<your_slack_token>"

  # ---- WeCom (Alertmanager reads via url_file, includes full URL + key) ----
  wecom_webhook_url: "http://swanlab-monitor-wecom-bridge.<your_namespace>:5001/send?key=<your_wecom_bot_key>"

  # ---- DingTalk (the bridge mounts this key as config.yml via subPath) ----
  dingtalk_config.yml: |
    targets:
      swanlab:
        url: https://oapi.dingtalk.com/robot/send?access_token=<your_dingtalk_access_token>
        secret: <your_dingtalk_secret> # leave empty string if signing is disabled
        mention:
          all: false

  # ---- Feishu (the bridge injects the following environment variables via envFrom) ----
  FEISHU_WEBHOOK_URL: "<your_feishu_webhook_url>"
  FEISHU_SECRET: "<your_feishu_secret>" # leave empty string if signature verification is disabled
  MESSAGE_TYPE: "interactive" # interactive=card message, text=plain text

---
# ---------- Alertmanager config Secret (pure routing config, no secrets) ----------
apiVersion: v1
kind: Secret
metadata:
  name: swanlab-monitor-alertmanager-config
  namespace: <your_namespace>
  labels:
    app.kubernetes.io/name: alertmanager
    app.kubernetes.io/instance: swanlab-monitor
type: Opaque
stringData:
  alertmanager.yml: |
    global:
      resolve_timeout: 5m

    route:
      receiver: im-all
      group_by: ['alertname', 'service', 'namespace']
      group_wait: 30s
      group_interval: 5m
      repeat_interval: 4h

    receivers:
      - name: im-all
        # Channel switches: comment out the corresponding config block to disable it (keep at least one channel)
        # Secrets are not in this file — they are read uniformly from /etc/alertmanager/secrets/

        # ---- Slack (native slack_configs) ----
        slack_configs:
          - api_url_file: /etc/alertmanager/secrets/slack_webhook_url
            channel: '#swanlab-alerts' # ← change to your actual channel
            send_resolved: true

        webhook_configs:
          # ---- DingTalk (requires deploying dingtalk.yaml) ----
          - url: 'http://swanlab-monitor-dingtalk-bridge.<your_namespace>:8060/dingtalk/swanlab/send'
            send_resolved: true

          # ---- Feishu (requires deploying feishu.yaml) ----
          - url: 'http://swanlab-monitor-feishu-bridge.<your_namespace>:8080/webhook'
            send_resolved: true

          # ---- WeCom (requires deploying wecom.yaml, URL includes key, read from credentials Secret) ----
          - url_file: /etc/alertmanager/secrets/wecom_webhook_url
            send_resolved: true

---
# ---------- Alertmanager StatefulSet ----------
apiVersion: apps/v1
kind: StatefulSet
metadata:
  name: swanlab-monitor-alertmanager
  namespace: <your_namespace>
  labels:
    app.kubernetes.io/name: alertmanager
    app.kubernetes.io/instance: swanlab-monitor
spec:
  serviceName: swanlab-monitor-alertmanager
  replicas: 1
  updateStrategy:
    type: RollingUpdate
  selector:
    matchLabels:
      app.kubernetes.io/name: alertmanager
      app.kubernetes.io/instance: swanlab-monitor
  template:
    metadata:
      labels:
        app.kubernetes.io/name: alertmanager
        app.kubernetes.io/instance: swanlab-monitor
    spec:
      serviceAccountName: default
      automountServiceAccountToken: false
      securityContext:
        fsGroup: 65534
        runAsUser: 65534
        runAsGroup: 65534
        runAsNonRoot: true
        seccompProfile:
          type: RuntimeDefault
      containers:
        - name: alertmanager
          image: repo.swanlab.cn/public/alertmanager:v0.32.2
          imagePullPolicy: IfNotPresent
          securityContext:
            allowPrivilegeEscalation: false
            capabilities:
              drop: ["ALL"]
            readOnlyRootFilesystem: true
          args:
            - "--config.file=/etc/alertmanager/alertmanager.yml"
            - "--storage.path=/alertmanager"
          ports:
            - name: web
              containerPort: 9093
          volumeMounts:
            - name: config
              mountPath: /etc/alertmanager
              readOnly: true
            - name: secrets # unified credentials Secret mount (for api_url_file / url_file reads)
              mountPath: /etc/alertmanager/secrets
              readOnly: true
            - name: data
              mountPath: /alertmanager
            - name: tmp
              mountPath: /tmp
          readinessProbe:
            httpGet:
              path: /-/ready
              port: web
            initialDelaySeconds: 5
            periodSeconds: 10
          livenessProbe:
            httpGet:
              path: /-/healthy
              port: web
            initialDelaySeconds: 30
            periodSeconds: 30
          resources:
            requests:
              cpu: 100m
              memory: 128Mi
            limits:
              cpu: 300m
              memory: 256Mi
      volumes:
        - name: config
          secret:
            secretName: swanlab-monitor-alertmanager-config
        - name: secrets
          secret:
            secretName: swanlab-monitor-channels-credentials
        - name: tmp
          emptyDir: {}
  volumeClaimTemplates:
    - metadata:
        name: data
      spec:
        accessModes: ["ReadWriteOnce"]
        resources:
          requests:
            storage: 20Gi
        storageClassName: <your_storageclass>
        volumeMode: Filesystem

---
# ---------- Alertmanager Service ----------
apiVersion: v1
kind: Service
metadata:
  name: swanlab-monitor-alertmanager
  namespace: <your_namespace>
  labels:
    app.kubernetes.io/name: alertmanager
    app.kubernetes.io/instance: swanlab-monitor
spec:
  type: ClusterIP
  ports:
    - name: web
      port: 9093
      targetPort: web
  selector:
    app.kubernetes.io/name: alertmanager
    app.kubernetes.io/instance: swanlab-monitor
After replacing the relevant fields, install the Alertmanager service:
kubectl apply -f swanlab-monitor-alertmanager.yaml -n <your_namespace>4.2 Webhook IM alert notification configuration
Based on the IM channels you actually enable, install the corresponding bridge services (channels not enabled in alertmanager.yml do not need to be installed):
IM channel bridge templates
# ============================================================
# DingTalk bridge — timonwong/prometheus-webhook-dingtalk, listens on 8060
# Secrets (access_token + signing secret) are read from the unified credentials Secret (swanlab-monitor-channels-credentials)
# ============================================================

---
# ---------- DingTalk Bridge Deployment ----------
apiVersion: apps/v1
kind: Deployment
metadata:
  name: swanlab-monitor-dingtalk-bridge
  namespace: <your_namespace>
  labels:
    app.kubernetes.io/name: dingtalk-bridge
    app.kubernetes.io/instance: swanlab-monitor
spec:
  replicas: 1
  selector:
    matchLabels:
      app.kubernetes.io/name: dingtalk-bridge
      app.kubernetes.io/instance: swanlab-monitor
  template:
    metadata:
      labels:
        app.kubernetes.io/name: dingtalk-bridge
        app.kubernetes.io/instance: swanlab-monitor
    spec:
      serviceAccountName: default
      automountServiceAccountToken: false
      securityContext:
        runAsNonRoot: true
        runAsUser: 65534
        runAsGroup: 65534
        seccompProfile:
          type: RuntimeDefault
      containers:
        - name: dingtalk-bridge
          image: repo.swanlab.cn/public/prometheus-webhook-dingtalk:v2.1.0
          imagePullPolicy: IfNotPresent
          securityContext:
            allowPrivilegeEscalation: false
            capabilities:
              drop: ["ALL"]
            readOnlyRootFilesystem: true
          args:
            - "--config.file=/etc/prometheus-webhook-dingtalk/config.yml"
            - "--web.listen-address=:8060"
            - "--web.enable-lifecycle"
          ports:
            - name: http
              containerPort: 8060
          volumeMounts:
            - name: credentials # read dingtalk_config.yml from the unified credentials Secret
              mountPath: /etc/prometheus-webhook-dingtalk
              readOnly: true
            - name: tmp
              mountPath: /tmp
          readinessProbe:
            tcpSocket:
              port: 8060
            initialDelaySeconds: 5
            periodSeconds: 10
          resources:
            requests:
              cpu: 50m
              memory: 32Mi
            limits:
              cpu: 100m
              memory: 64Mi
      volumes:
        - name: credentials # unified credentials Secret (dingtalk_config.yml key → config.yml file)
          secret:
            secretName: swanlab-monitor-channels-credentials
            items:
              - key: dingtalk_config.yml
                path: config.yml
        - name: tmp
          emptyDir: {}

---
# ---------- DingTalk Bridge Service ----------
apiVersion: v1
kind: Service
metadata:
  name: swanlab-monitor-dingtalk-bridge
  namespace: <your_namespace>
  labels:
    app.kubernetes.io/name: dingtalk-bridge
    app.kubernetes.io/instance: swanlab-monitor
spec:
  type: ClusterIP
  ports:
    - name: http
      port: 8060
      targetPort: http
  selector:
    app.kubernetes.io/name: dingtalk-bridge
app.kubernetes.io/instance: swanlab-monitor# ============================================================
# Feishu bridge — alertmanager-feishu, listens on 8080
# Injects FEISHU_WEBHOOK_URL / FEISHU_SECRET / MESSAGE_TYPE from the unified credentials Secret via envFrom
# ============================================================
---
# ---------- Feishu Bridge Deployment ----------
apiVersion: apps/v1
kind: Deployment
metadata:
name: swanlab-monitor-feishu-bridge
namespace: <your_namespace>
labels:
app.kubernetes.io/name: feishu-bridge
app.kubernetes.io/instance: swanlab-monitor
spec:
replicas: 1
selector:
matchLabels:
app.kubernetes.io/name: feishu-bridge
app.kubernetes.io/instance: swanlab-monitor
template:
metadata:
labels:
app.kubernetes.io/name: feishu-bridge
app.kubernetes.io/instance: swanlab-monitor
spec:
serviceAccountName: default
automountServiceAccountToken: false
securityContext:
runAsNonRoot: true
runAsUser: 1000
runAsGroup: 1000
seccompProfile:
type: RuntimeDefault
containers:
- name: feishu-bridge
image: repo.swanlab.cn/public/alertmanager-feishu:dev
imagePullPolicy: IfNotPresent
securityContext:
allowPrivilegeEscalation: false
capabilities:
drop: ["ALL"]
readOnlyRootFilesystem: true
command: ["/app/.venv/bin/alertmanager-feishu", "serve"]
envFrom:
- secretRef:
name: swanlab-monitor-channels-credentials
volumeMounts:
- name: tmp
mountPath: /tmp
ports:
- name: http
containerPort: 8080
readinessProbe:
tcpSocket:
port: 8080
initialDelaySeconds: 5
periodSeconds: 10
livenessProbe:
tcpSocket:
port: 8080
initialDelaySeconds: 20
periodSeconds: 30
resources:
requests:
cpu: 100m
memory: 64Mi
limits:
cpu: 200m
memory: 128Mi
volumes:
- name: tmp
emptyDir: {}
---
# ---------- Feishu Bridge Service ----------
apiVersion: v1
kind: Service
metadata:
name: swanlab-monitor-feishu-bridge
namespace: <your_namespace>
labels:
app.kubernetes.io/name: feishu-bridge
app.kubernetes.io/instance: swanlab-monitor
spec:
type: ClusterIP
ports:
- name: http
port: 8080
targetPort: http
selector:
app.kubernetes.io/name: feishu-bridge
app.kubernetes.io/instance: swanlab-monitor# ============================================================
# WeCom bridge — rea1shane/a2w, listens on 5001
# key is configured in Alertmanager's webhook URL; the bridge itself needs no credentials
# To @mention specific users: append &mention=user1&mention=user2 to wecom_webhook_url
# Mounts standard.tmpl to read standard fields (severity/summary/description), consistent with Slack/DingTalk/Feishu
# ============================================================
---
# ---------- WeCom Bridge Template ConfigMap ----------
# A custom template replaces a2w's built-in base.tmpl (base.tmpl reads level/current/labels).
# This template reads Alertmanager common fields, making the 4 IM channels' fields consistent so rules don't need WeCom-specific fields.
apiVersion: v1
kind: ConfigMap
metadata:
name: swanlab-monitor-wecom-bridge-template
namespace: <your_namespace>
labels:
app.kubernetes.io/name: wecom-bridge
app.kubernetes.io/instance: swanlab-monitor
data:
standard.tmpl: |
{{ range $i, $alert := .Alerts }}
{{- if eq $alert.Status "firing" }}
<font color="warning">**[firing] {{ or $alert.Annotations.summary $alert.Labels.alertname }}**</font>
{{- with $alert.Labels.severity }}
**Severity**: {{ . }}
{{- end }}
**Triggered At**: {{ timeFormat ($alert.StartsAt) }}
**Duration**: {{ timeFromNow ($alert.StartsAt) }}
{{- with $alert.Annotations.description }}
**Details**: {{ . }}
{{- end }}
{{- else if eq $alert.Status "resolved" }}
<font color="info">**[resolved] {{ or $alert.Annotations.summary $alert.Labels.alertname }}**</font>
**Triggered At**: {{ timeFormat ($alert.StartsAt) }}
**Recovered At**: {{ timeFormat ($alert.EndsAt) }}
**Duration**: {{ timeDuration ($alert.StartsAt) ($alert.EndsAt) }}
{{- with $alert.Annotations.description }}
**Details**: {{ . }}
{{- end }}
{{- end }}
{{- with $alert.GeneratorURL }}
[🔍 Prometheus]({{ . }})
{{- end }}
{{ end }}
---
# ---------- WeCom Bridge Deployment ----------
apiVersion: apps/v1
kind: Deployment
metadata:
name: swanlab-monitor-wecom-bridge
namespace: <your_namespace>
labels:
app.kubernetes.io/name: wecom-bridge
app.kubernetes.io/instance: swanlab-monitor
spec:
replicas: 1
selector:
matchLabels:
app.kubernetes.io/name: wecom-bridge
app.kubernetes.io/instance: swanlab-monitor
template:
metadata:
labels:
app.kubernetes.io/name: wecom-bridge
app.kubernetes.io/instance: swanlab-monitor
spec:
serviceAccountName: default
automountServiceAccountToken: false
securityContext:
runAsNonRoot: true
runAsUser: 65534
runAsGroup: 65534
seccompProfile:
type: RuntimeDefault
containers:
- name: wecom-bridge
image: repo.swanlab.cn/public/a2w:latest
imagePullPolicy: IfNotPresent
args:
- "--template=/etc/a2w/template/standard.tmpl" # use the custom standard-field template to replace a2w's built-in base.tmpl
securityContext:
allowPrivilegeEscalation: false
capabilities:
drop: ["ALL"]
readOnlyRootFilesystem: true
env:
- name: TZ
value: Asia/Shanghai # a2w displays alert times in the local timezone
ports:
- name: http
containerPort: 5001
readinessProbe: # a2w has no standard health endpoint, use tcpSocket to probe the port
tcpSocket:
port: 5001
initialDelaySeconds: 5
periodSeconds: 10
livenessProbe:
tcpSocket:
port: 5001
initialDelaySeconds: 20
periodSeconds: 30
resources:
requests:
cpu: 50m
memory: 32Mi
limits:
cpu: 100m
memory: 64Mi
volumeMounts: # mount the custom template (read-only)
- name: wecom-template
mountPath: /etc/a2w/template
readOnly: true
volumes: # custom template ConfigMap
- name: wecom-template
configMap:
name: swanlab-monitor-wecom-bridge-template
---
# ---------- WeCom Bridge Service ----------
apiVersion: v1
kind: Service
metadata:
name: swanlab-monitor-wecom-bridge
namespace: <your_namespace>
labels:
app.kubernetes.io/name: wecom-bridge
app.kubernetes.io/instance: swanlab-monitor
spec:
type: ClusterIP
ports:
- name: http
port: 5001
targetPort: http
selector:
app.kubernetes.io/name: wecom-bridge
app.kubernetes.io/instance: swanlab-monitorInstall the bridge services for the channels you actually enable, as needed:
# DingTalk
kubectl apply -f dingtalk.yaml -n <your_namespace>

# Feishu
kubectl apply -f feishu.yaml -n <your_namespace>

# WeCom
kubectl apply -f wecom.yaml -n <your_namespace>
📝 Log Collection Service
🚧 The log collection configuration guide (e.g.,
Loki + Promtail,ELK) is being written. Stay tuned.
In the meantime, you can view each service Pod's runtime logs via kubectl logs, or observe them through your public cloud's built-in cluster Pod log service:
kubectl logs -n <your_namespace> <pod_name> -c <container_name>❓ FAQ
Why does the Metrics endpoint return 404?
The most likely cause is an incorrect request method. Make sure you use HTTP GET to access the metrics endpoint. Also ensure the service, port, and path are all correct.
What do the metrics returned by the Metrics endpoint represent?
The Metrics endpoint follows the Prometheus format specification and typically returns information such as request QPS, request latency, and request error rate, along with internal runtime metrics for languages such as Node.js and Go. Because of the large number of metrics, the Grafana dashboards only surface a few of the most important ones. If you have other observability metric needs, you can verify the Metrics endpoint as described in the prerequisites, or manually retrieve all metrics from the Prometheus panel for further filtering and analysis.
Does the Metrics endpoint return CPU, memory, and other metrics?
Yes, but they are all process-level metrics. They are collected by the Prometheus client libraries by default, with negligible overhead, and only read the process's own /proc/self information, so no extra permissions are required:
- SwanLab-Server (Node.js):
process_cpu_user_seconds_total,process_cpu_system_seconds_total(cumulative user/system CPU seconds consumed by the process; applyingrate()yields CPU usage in cores),process_resident_memory_bytes(process resident memory / RSS, in bytes). - SwanLab-House (Go):
process_cpu_seconds_total(cumulative user + system CPU seconds),process_resident_memory_bytes(RSS),process_virtual_memory_bytes(virtual memory),process_open_fds(number of open file descriptors), plus Go runtime metrics such asgo_goroutinesandgo_memstats_*.
Note that these metrics reflect the resource usage of each service process itself, not node/host-level resource metrics. In cloud-native environments, node-level resource metrics are typically collected by cAdvisor, node-exporter, or cloud provider monitoring components, which require higher permissions — deploy those components if you need them.
Why do panels in the SwanLab monitoring dashboards show no data?
CPU and memory panels are populated from the process-level metrics exposed by each service's own Metrics endpoint (see the previous question) — like the QPS and latency panels, they rely on Prometheus scraping the SwanLab services, not on any additional hardware monitoring components. If panels show no data, the recommended troubleshooting steps are:
- Check whether the corresponding metric exists in the Prometheus panel;
- If it exists, the Grafana dashboard metric query configuration may be incorrect and needs to be modified;
- If it does not exist, there is an issue with the Prometheus scrape job that needs to be investigated.
Is monitoring of Redis, PostgreSQL, ClickHouse, and other base services supported?
Yes. PostgreSQL, Redis, and ClickHouse all have corresponding exporters (e.g., postgres_exporter, redis_exporter). Refer to "2.2 Install database Exporter services" above to deploy the corresponding Exporter services and import the corresponding Grafana dashboards to observe base service metrics.