swanlab.Object3D
| Parameter | Description |
|---|---|
| data | (Union[np.ndarray, str, Path]) Accepts point cloud file paths or NumPy arrays. The Object3D class will determine the received data type and perform corresponding conversions. |
| caption | (str) Label for the 3D object. Used to mark the 3D object when displayed in the experiment dashboard. |
Introduction
Converts various types of point cloud data to be logged by swanlab.log().
Creating from Files/Dictionaries
Example File
data.swanlab.pts.json: Download from Google Drive
The file format is json, with the following content structure:
json
{
"points": [
[x1, y1, z1, r1, g1, b1],
[x2, y2, z2, r2, g2, b2],
...
],
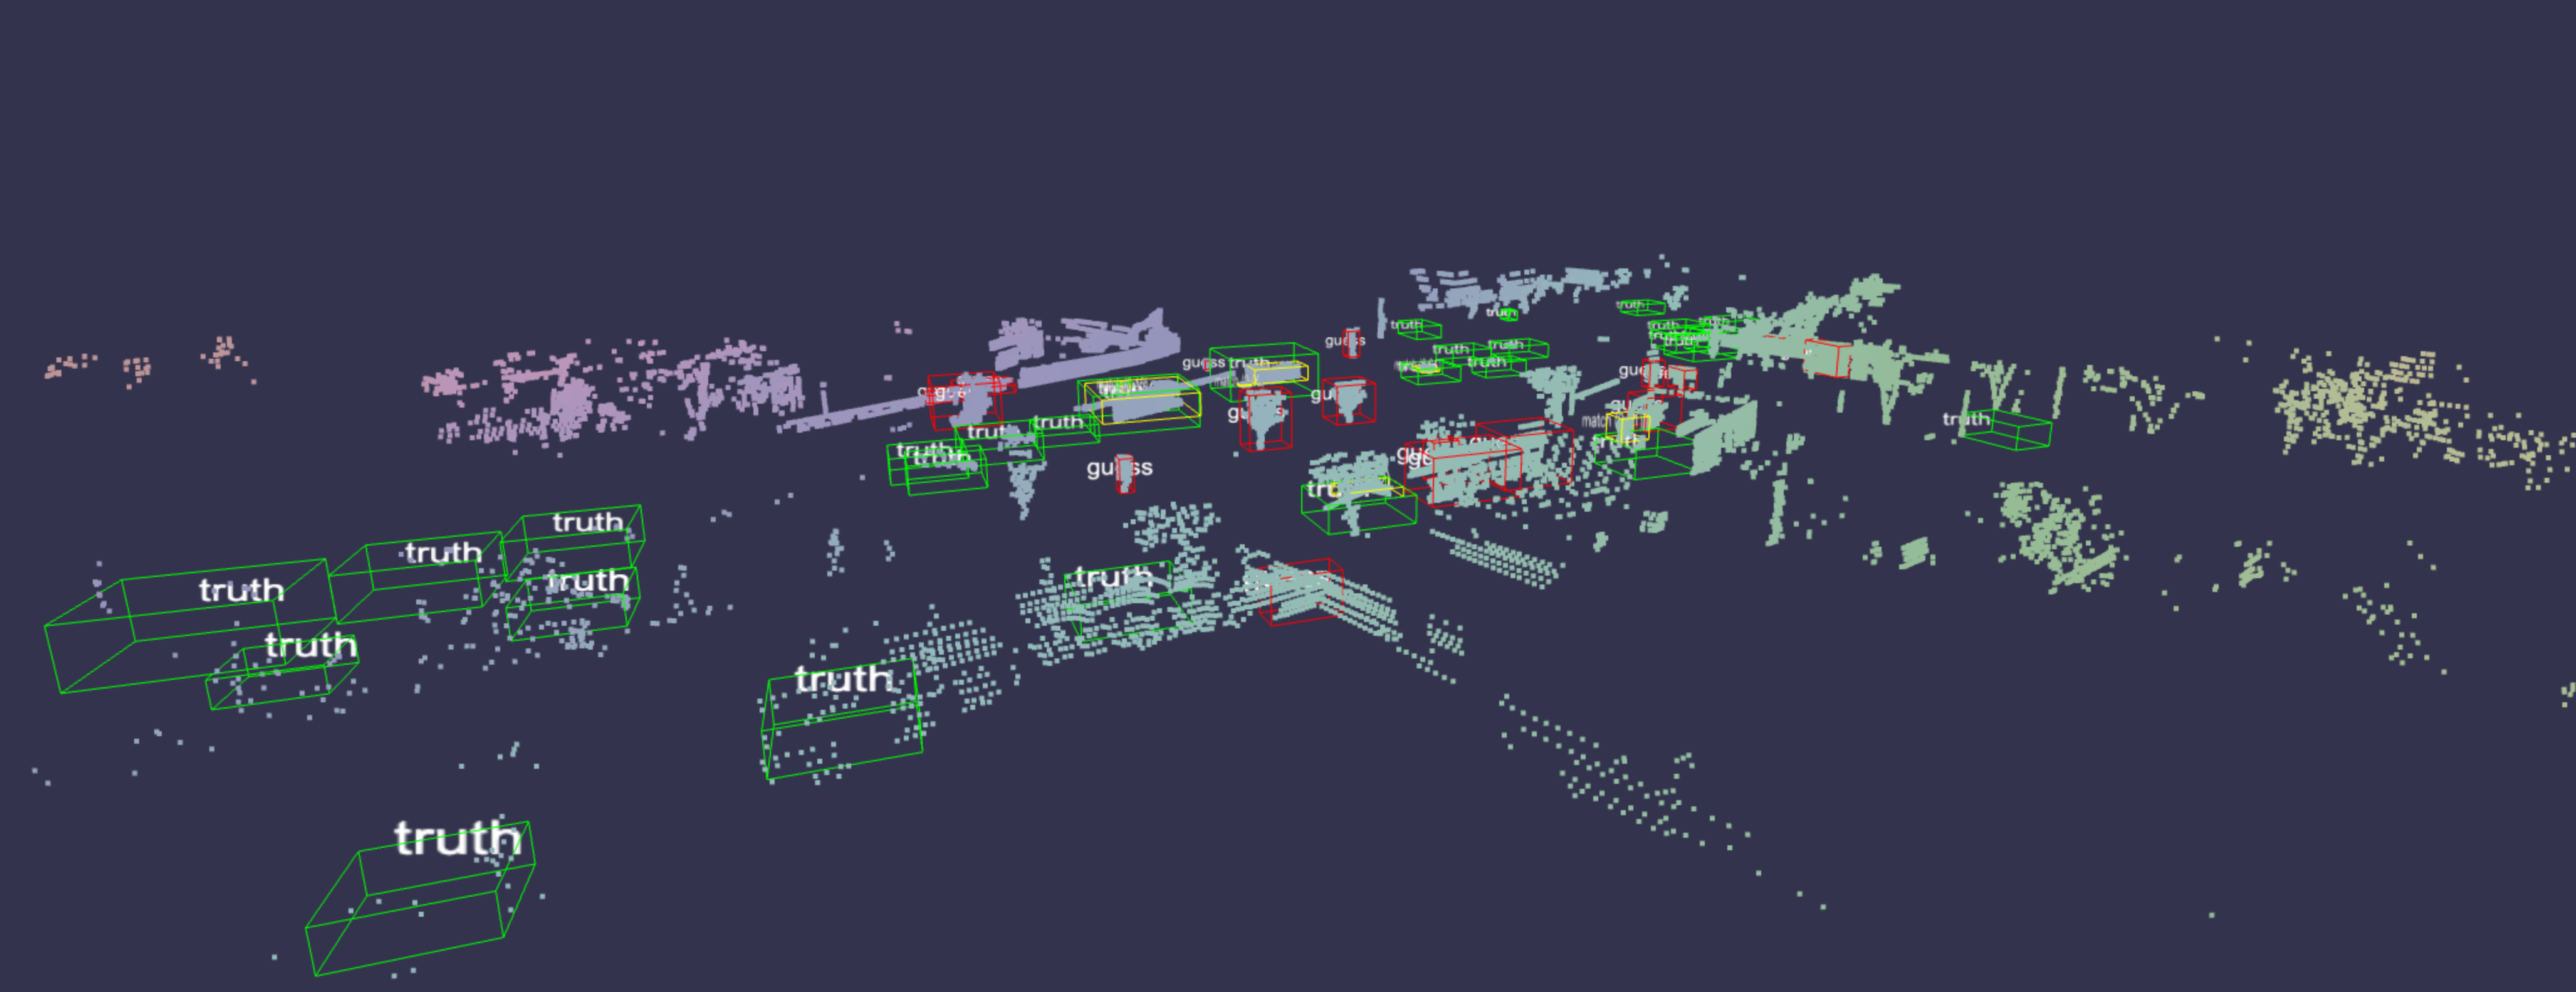
// (Optional) Detection boxes for tasks such as point cloud detection, highlighting corresponding positions
"boxes": [
{
"color": [r, g, b],
"corners": [[x1,y1,z1], ..., [x8,y8,z8]],
// (Optional) Label text for the detection box, displayed in the view
"label": "class_name",
// (Optional) Confidence score, displayed in the view
"score": 0.95,
},
...
]
}Detailed Explanation of JSON File Parameters:
points:- This is an array used to store 3D point cloud data.
- Each element is an array of 6 numerical values
[x, y, z, r, g, b], representing:x,y,z: 3D coordinates of the point.r,g,b: Color of the point, representing red, green, and blue channel values, typically in the range 0-255.
boxes(Optional):- This is an array used to store 3D detection box data.
- Each element is an object representing a detection box, containing the following fields:
color: Color of the detection box, an[r, g, b]array representing red, green, and blue channel values.corners: Coordinates of the eight vertices of the detection box, an[[x1, y1, z1], ..., [x8, y8, z8]]array, where each element is a 3D coordinate[x, y, z].label(Optional): Label text of the detection box, a string, used to display the category of the detection box in the view.score(Optional): Confidence score of the detection box, a numerical value, typically in the range 0-1, representing the reliability of the detection box.
Using SwanLab to log 3D point cloud data from a json file:
python
import swanlab

swanlab.init()

obj = swanlab.Object3D("data.swanlab.pts.json", caption="3d_point_cloud")
swanlab.log({"examples": obj})
python
import swanlab

swanlab.init()

with open("data.swanlab.pts.json", "r") as f:
    cloud_point = json.load(f)

obj = swanlab.Object3D.from_point_data(
    points=cloud_point["points"],
    boxes=cloud_point["boxes"],
    caption="3d_point_cloud"
)

swanlab.log({"examples": obj})
Creating from NumPy Arrays
python
import numpy as np

# Example 1: Create point cloud from coordinates
points_xyz = np.array([
    [0, 0, 0],  # Point1: x=0, y=0, z=0
    [1, 1, 1],  # Point2: x=1, y=1, z=1
    [2, 0, 1]   # Point3: x=2, y=0, z=1
])

cloud_xyz = swanlab.Object3D(points_xyz, caption="Basic XYZ Points")
swanlab.log({"examples": cloud_xyz})
python
import numpy as np

# Example 2: Create point cloud with categories
points_xyzc = np.array([
    [0, 0, 0, 0],  # Point1: xyz + category 0
    [1, 1, 1, 1],  # Point2: xyz + category 1
    [2, 0, 1, 2]   # Point3: xyz + category 2
])

cloud_xyzc = swanlab.Object3D(points_xyzc, caption="Points with Categories")
swanlab.log({"examples": cloud_xyzc})
python
import numpy as np

# Example 3: Create point cloud with RGB colors
points_xyzrgb = np.array([
    [0, 0, 0, 255, 0, 0],    # Point1: xyz + red
    [1, 1, 1, 0, 255, 0],    # Point2: xyz + green
    [2, 0, 1, 0, 0, 255]     # Point3: xyz + blue
])

cloud_xyzrgb = swanlab.Object3D(points_xyzrgb, caption="Colored Points")
swanlab.log({"examples": cloud_xyzrgb})
Logging Multiple Point Clouds in a Single Step
python
import swanlab

...

cloud1 = swanlab.Object3D(points1, caption="cloud1")
cloud2 = swanlab.Object3D(points2, caption="cloud2")
cloud3 = swanlab.Object3D(points3, caption="cloud3")

...

swanlab.log({"examples": [cloud1, cloud2, cloud3, ...]})