Log Custom 3D Chart
SwanLab provides API compatibility with pyecharts, enabling seamless recording of pyecharts charts to SwanLab for rich visualization. Click the tag below for an online demo:

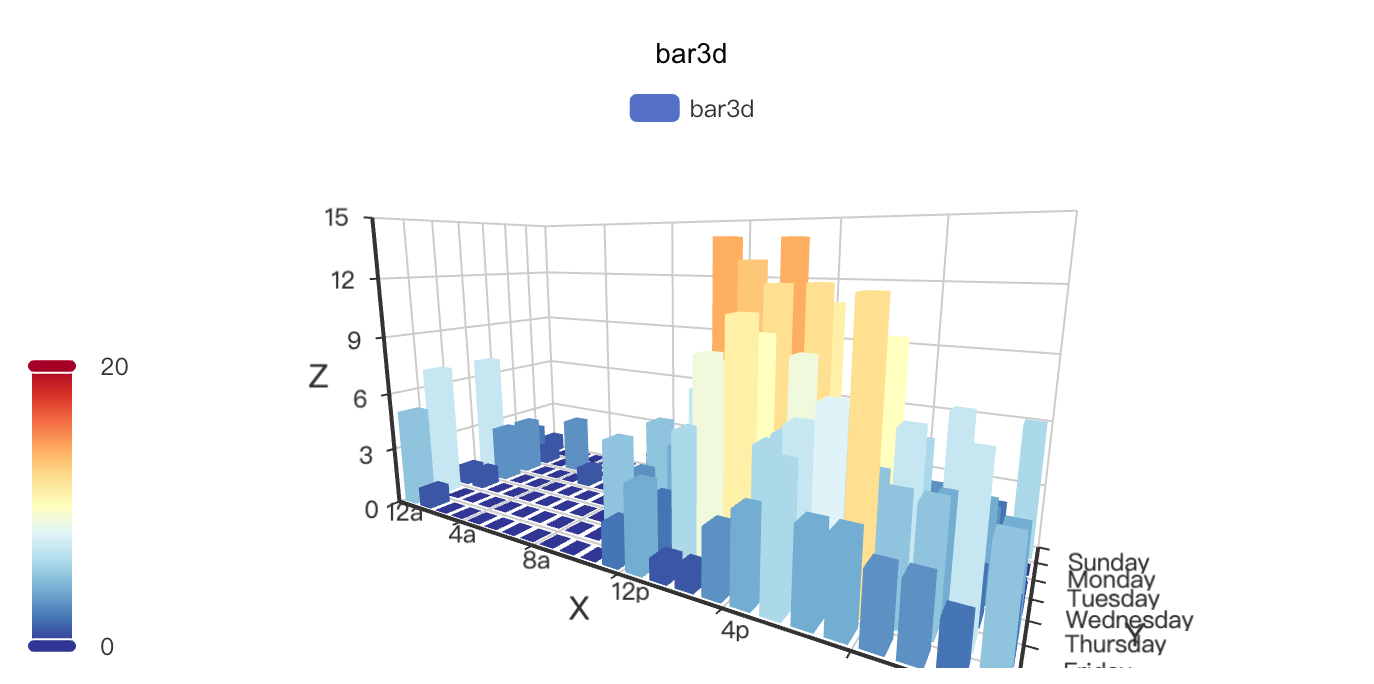
Bar3D
python
import swanlab
import pyecharts.options as opts
swanlab.init(project="swanlab-echarts-3d-demo")
# Define data
hours = ["12a", "1a", "2a", "3a", "4a", "5a", "6a", "7a", "8a", "9a", "10a", "11a", "12p", "1p", "2p", "3p", "4p", "5p", "6p", "7p", "8p", "9p", "10p", "11p"]
days = ["Saturday", "Friday", "Thursday", "Wednesday", "Tuesday", "Monday", "Sunday"]
data = [
[0, 0, 5], [0, 1, 1], [0, 2, 0], [0, 3, 0], [0, 4, 0], [0, 5, 0], [0, 6, 0], [0, 7, 0], [0, 8, 0], [0, 9, 0], [0, 10, 0], [0, 11, 2], [0, 12, 4], [0, 13, 1], [0, 14, 1], [0, 15, 3], [0, 16, 4], [0, 17, 6], [0, 18, 4], [0, 19, 4], [0, 20, 3], [0, 21, 3], [0, 22, 2], [0, 23, 5],
[1, 0, 7],[1, 1, 0],[1, 2, 0],[1, 3, 0],[1, 4, 0],[1, 5, 0],[1, 6, 0],[1, 7, 0],[1, 8, 0],[1, 9, 0],[1, 10, 5],[1, 11, 2],[1, 12, 2],[1, 13, 6],[1, 14, 9],[1, 15, 11],[1, 16, 6],[1, 17, 7],[1, 18, 8],[1, 19, 12],[1, 20, 5],[1, 21, 5],[1, 22, 7],[1, 23, 2],
[2, 0, 1],[2, 1, 1],[2, 2, 0],[2, 3, 0],[2, 4, 0],[2, 5, 0],[2, 6, 0],[2, 7, 0],[2, 8, 0],[2, 9, 0],[2, 10, 3],[2, 11, 2],[2, 12, 1],[2, 13, 9],[2, 14, 8],[2, 15, 10],[2, 16, 6],[2, 17, 5],[2, 18, 5],[2, 19, 5],[2, 20, 7],[2, 21, 4],[2, 22, 2],[2, 23, 4],
[3, 0, 7],[3, 1, 3],[3, 2, 0],[3, 3, 0],[3, 4, 0],[3, 5, 0],[3, 6, 0],[3, 7, 0],[3, 8, 1],[3, 9, 0],[3, 10, 5],[3, 11, 4],[3, 12, 7],[3, 13, 14],[3, 14, 13],[3, 15, 12],[3, 16, 9],[3, 17, 5],[3, 18, 5],[3, 19, 10],[3, 20, 6],[3, 21, 4],[3, 22, 4],[3, 23, 1],
[4, 0, 1],[4, 1, 3],[4, 2, 0],[4, 3, 0],[4, 4, 0],[4, 5, 1],[4, 6, 0],[4, 7, 0],[4, 8, 0],[4, 9, 2],[4, 10, 4],[4, 11, 4],[4, 12, 2],[4, 13, 4],[4, 14, 4],[4, 15, 14],[4, 16, 12],[4, 17, 1],[4, 18, 8],[4, 19, 5],[4, 20, 3],[4, 21, 7],[4, 22, 3],[4, 23, 0],
[5, 0, 2],[5, 1, 1],[5, 2, 0],[5, 3, 3],[5, 4, 0],[5, 5, 0],[5, 6, 0],[5, 7, 0],[5, 8, 2],[5, 9, 0],[5, 10, 4],[5, 11, 1],[5, 12, 5],[5, 13, 10],[5, 14, 5],[5, 15, 7],[5, 16, 11],[5, 17, 6],[5, 18, 0],[5, 19, 5],[5, 20, 3],[5, 21, 4],[5, 22, 2],[5, 23, 0],
[6, 0, 1],[6, 1, 0],[6, 2, 0],[6, 3, 0],[6, 4, 0],[6, 5, 0],[6, 6, 0],[6, 7, 0],[6, 8, 0],[6, 9, 0],[6, 10, 1],[6, 11, 0],[6, 12, 2],[6, 13, 1],[6, 14, 3],[6, 15, 4],[6, 16, 0],[6, 17, 0],[6, 18, 0],[6, 19, 0],[6, 20, 1],[6, 21, 2],[6, 22, 2],[6, 23, 6],
]
data = [[d[1], d[0], d[2]] for d in data]
# Create echarts bar3d object
bar3d = swanlab.echarts.Bar3D()
# Set bar3d data
bar3d.add(
"bar3d",
data,
xaxis3d_opts=opts.Axis3DOpts(data=hours, type_="category"),
yaxis3d_opts=opts.Axis3DOpts(data=days, type_="category"),
zaxis3d_opts=opts.Axis3DOpts(data=data, type_="value"),
)
bar3d.set_global_opts(
visualmap_opts=opts.VisualMapOpts(
max_=20,
range_color=[
"#313695",
"#4575b4",
"#74add1",
"#abd9e9",
"#e0f3f8",
"#ffffbf",
"#fee090",
"#fdae61",
"#f46d43",
"#d73027",
"#a50026",
],
)
)
# Log to SwanLab
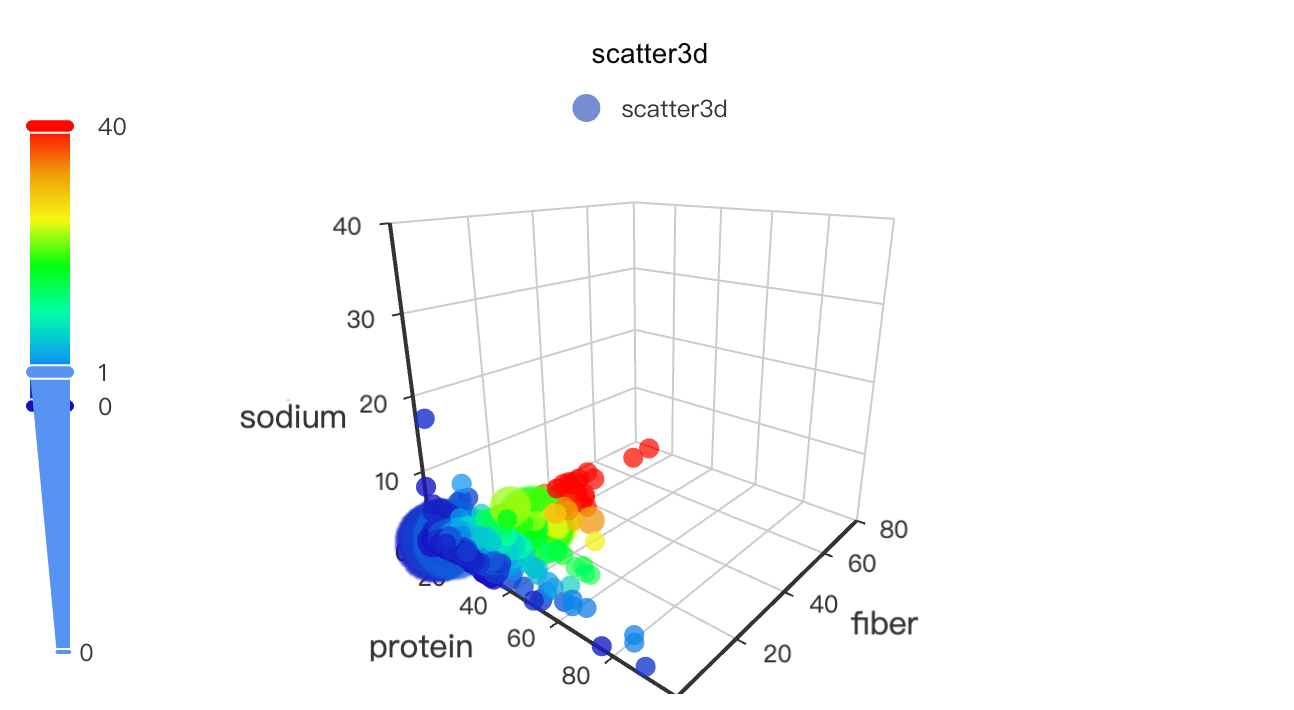
swanlab.log({"bar3d": bar3d})Scatter3D
python
import asyncio
from aiohttp import TCPConnector, ClientSession
import swanlab
import pyecharts.options as opts
swanlab.init(project="swanlab-echarts-3d-demo")
# Define data
async def get_json_data(url: str) -> dict:
async with ClientSession(connector=TCPConnector(ssl=False)) as session:
async with session.get(url=url) as response:
return await response.json()
# Get echarts official example data
data = asyncio.run(
get_json_data(
url="https://echarts.apache.org/examples/data/asset/data/nutrients.json"
)
)
# Column name mapping
field_indices = {
"calcium": 3,
"calories": 12,
"carbohydrate": 8,
"fat": 10,
"fiber": 5,
"group": 1,
"id": 16,
"monounsat": 14,
"name": 0,
"polyunsat": 15,
"potassium": 7,
"protein": 2,
"saturated": 13,
"sodium": 4,
"sugars": 9,
"vitaminc": 6,
"water": 11,
}
# Config
config_xAxis3D = "protein"
config_yAxis3D = "fiber"
config_zAxis3D = "sodium"
config_color = "fiber"
config_symbolSize = "vitaminc"
# Construct data
"""
数据结构为[[x, y, z, color, size, index]]
例子:
[[19.9, 0.4, 0.385, 0.4, 0.0769, 0],
[35.8, 2, 0.717, 2, 0.138, 1],
[23.5, 1.6, 0.78, 1.6, 0.0012, 2], ...]
"""
data = [
[
item[field_indices[config_xAxis3D]],
item[field_indices[config_yAxis3D]],
item[field_indices[config_zAxis3D]],
item[field_indices[config_color]],
item[field_indices[config_symbolSize]],
index,
]
for index, item in enumerate(data)
]
# Create echarts scatter3d object
scatter3d = swanlab.echarts.Scatter3D()
# Set scatter3d data
scatter3d.add(
"scatter3d",
data,
xaxis3d_opts=opts.Axis3DOpts(name=config_xAxis3D, type_="value"),
yaxis3d_opts=opts.Axis3DOpts(name=config_yAxis3D, type_="value"),
zaxis3d_opts=opts.Axis3DOpts(name=config_zAxis3D, type_="value"),
grid3d_opts=opts.Grid3DOpts(width=100, height=100, depth=100),
)
scatter3d.set_global_opts(
visualmap_opts=[
opts.VisualMapOpts(
type_="color",
is_calculable=True,
dimension=3,
pos_top="10",
max_=79 / 2,
range_color=[
"#1710c0",
"#0b9df0",
"#00fea8",
"#00ff0d",
"#f5f811",
"#f09a09",
"#fe0300",
],
),
opts.VisualMapOpts(
type_="size",
is_calculable=True,
dimension=4,
pos_bottom="10",
max_=2.4 / 2,
range_size=[10, 40],
),
]
)
# Log to SwanLab
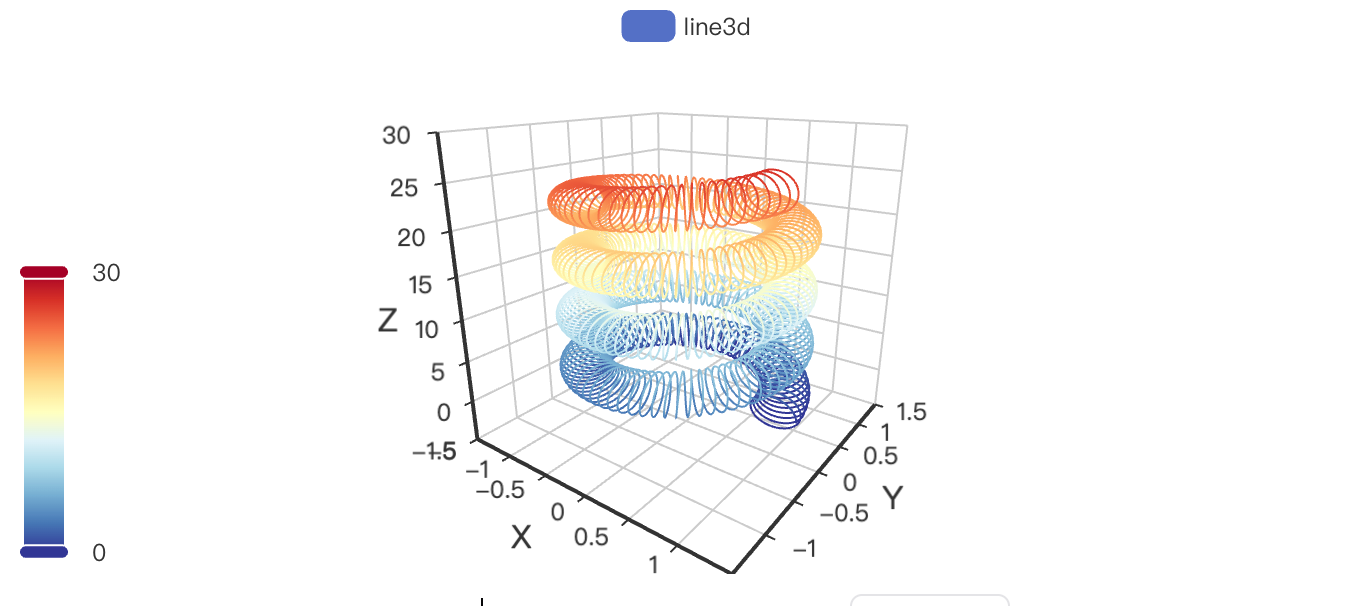
swanlab.log({"scatter3d": scatter3d})Line3D
python
import math
import swanlab
import pyecharts.options as opts
from pyecharts.faker import Faker
swanlab.init(project="swanlab-echarts-3d-demo")
# Construct data
data = []
for t in range(0, 25000):
_t = t / 1000
x = (1 + 0.25 * math.cos(75 * _t)) * math.cos(_t)
y = (1 + 0.25 * math.cos(75 * _t)) * math.sin(_t)
z = _t + 2.0 * math.sin(75 * _t)
data.append([x, y, z])
# Create echarts line3d object
line3d = swanlab.echarts.Line3D()
# Set line3d data
line3d.add(
"line3d",
data,
xaxis3d_opts=opts.Axis3DOpts(Faker.clock, type_="value"),
yaxis3d_opts=opts.Axis3DOpts(Faker.week_en, type_="value"),
grid3d_opts=opts.Grid3DOpts(width=100, depth=100),
)
line3d.set_global_opts(
visualmap_opts=opts.VisualMapOpts(
max_=30, min_=0, range_color=Faker.visual_color
),
)
# Log to SwanLab
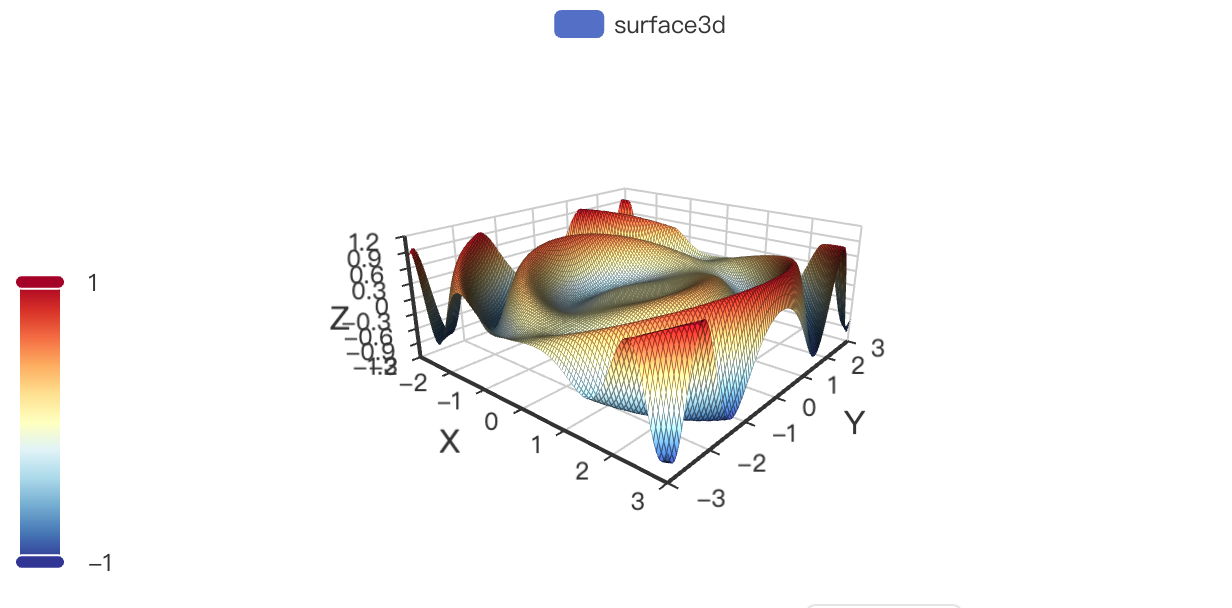
swanlab.log({"line3d": line3d})Surface3D
python
import math
import swanlab
import pyecharts.options as opts
from typing import Union

swanlab.init(project="swanlab-echarts-3d-demo")

# Construct data
def float_range(start: int, end: int, step: Union[int, float], round_number: int = 2):
    """
    浮点数 range
    :param start: 起始值
    :param end: 结束值
    :param step: 步长
    :param round_number: 精度
    :return: 返回一个 list
    """
    temp = []
    while True:
        if start < end:
            temp.append(round(start, round_number))
            start += step
        else:
            break
    return temp


def surface3d_data():
    for t0 in float_range(-3, 3, 0.05):
        y = t0
        for t1 in float_range(-3, 3, 0.05):
            x = t1
            z = math.sin(x**2 + y**2) * x / 3.14
            yield [x, y, z]


# Create echarts surface3d object
surface3d = swanlab.echarts.Surface3D()

# Set surface3d data
surface3d.add(
    "surface3d",
    data=list(surface3d_data()),
    xaxis3d_opts=opts.Axis3DOpts(type_="value"),
    yaxis3d_opts=opts.Axis3DOpts(type_="value"),
    grid3d_opts=opts.Grid3DOpts(width=100, height=40, depth=100),
)

surface3d.set_global_opts(
        visualmap_opts=opts.VisualMapOpts(
            dimension=2,
            max_=1,
            min_=-1,
            range_color=[
                "#313695",
                "#4575b4",
                "#74add1",
                "#abd9e9",
                "#e0f3f8",
                "#ffffbf",
                "#fee090",
                "#fdae61",
                "#f46d43",
                "#d73027",
                "#a50026",
            ],
        )
    )

# Log to SwanLab
swanlab.log({"surface3d": surface3d})