Logging PR Curve
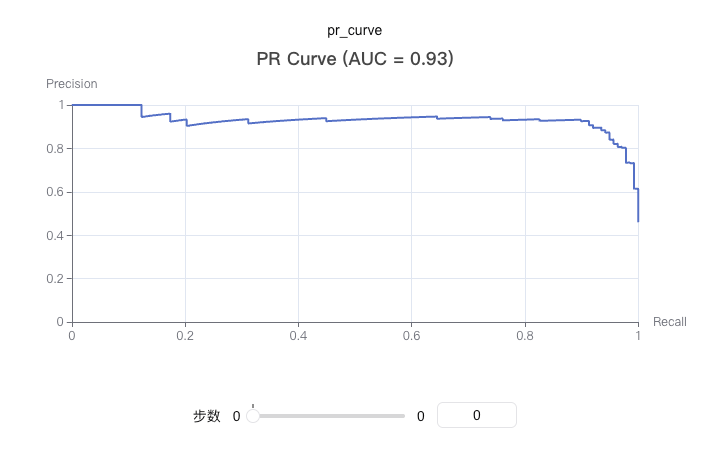
The PR (Precision-Recall) curve illustrates the relationship between precision and recall at various threshold levels. Plotting a PR curve is useful for evaluating the performance of binary classification models.
PR curves are especially suitable for imbalanced datasets, as they provide a better assessment of model performance on the minority class.
You can use swanlab.echarts.pr_curve to log a PR curve.

Basic Usage
python
from sklearn.datasets import make_classification
from sklearn.model_selection import train_test_split
import xgboost as xgb
import swanlab

# Generate sample data
X, y = make_classification(n_samples=1000, n_features=20, n_informative=2, n_redundant=10, random_state=42)
X_train, X_test, y_train, y_test = train_test_split(X, y, test_size=0.3, random_state=42)

# Train the model
model = xgb.XGBClassifier(use_label_encoder=False, eval_metric='logloss')
model.fit(X_train, y_train)

# Get predicted probabilities
y_pred_proba = model.predict_proba(X_test)[:, 1]

# Initialize SwanLab
swanlab.init(project="PR-Curve-Demo", experiment_name="PR-Curve-Example")

# Log the PR curve
swanlab.log({
    "pr_curve": swanlab.echarts.pr_curve(y_test, y_pred_proba, title=True)
})

swanlab.finish()
Custom Title
python
# Hide title (default)
pr_curve = swanlab.echarts.pr_curve(y_test, y_pred_proba, title=False)
swanlab.log({"pr_curve_no_title": pr_curve})

# Show default title
pr_curve = swanlab.echarts.pr_curve(y_test, y_pred_proba, title=True)
swanlab.log({"pr_curve_with_title": pr_curve})

# Custom title
pr_curve = swanlab.echarts.pr_curve(y_test, y_pred_proba, title="demo")
swanlab.log({"pr_curve_with_custom_title": pr_curve})
Notes
- Data Format:
y_trueandy_pred_probacan be lists or numpy arrays. - Binary Classification: This function is designed specifically for binary classification tasks.
- Probability Values:
y_pred_probashould be the predicted probabilities for the positive class, ranging from 0 to 1. - Dependencies: Requires installing the
scikit-learnandpyechartspackages. - AUC Calculation: The function automatically computes the area under the PR curve (AUC), but it is not displayed in the title by default.