System Hardware Monitoring
During experiment tracking, SwanLab automatically monitors machine hardware resources and records them in the System Charts. Currently supported hardware:
| Hardware | Info Logging | Resource Monitoring | Script |
|---|---|---|---|
| NVIDIA GPU | ✅ | ✅ | nvidia.py |
| AMD GPU | ✅ | ✅ | amd.py |
| Ascend NPU | ✅ | ✅ | ascend.py |
| Cambricon MLU | ✅ | ✅ | cambricon.py |
| Kunlunxin XPU | ✅ | ✅ | kunlunxin.py |
| MooreThread GPU | ✅ | ✅ | moorethreads.py |
| MetaX GPU | ✅ | ✅ | metax.py |
| Iluvatar GPU | ✅ | ✅ | iluvatar.py |
| Hygon DCU | ✅ | ✅ | hygon.py |
| CPU | ✅ | ✅ | cpu.py |
| Memory | ✅ | ✅ | memory.py |
| Disk | ✅ | ✅ | builder.py |
| Network | ✅ | ✅ | builder.py |
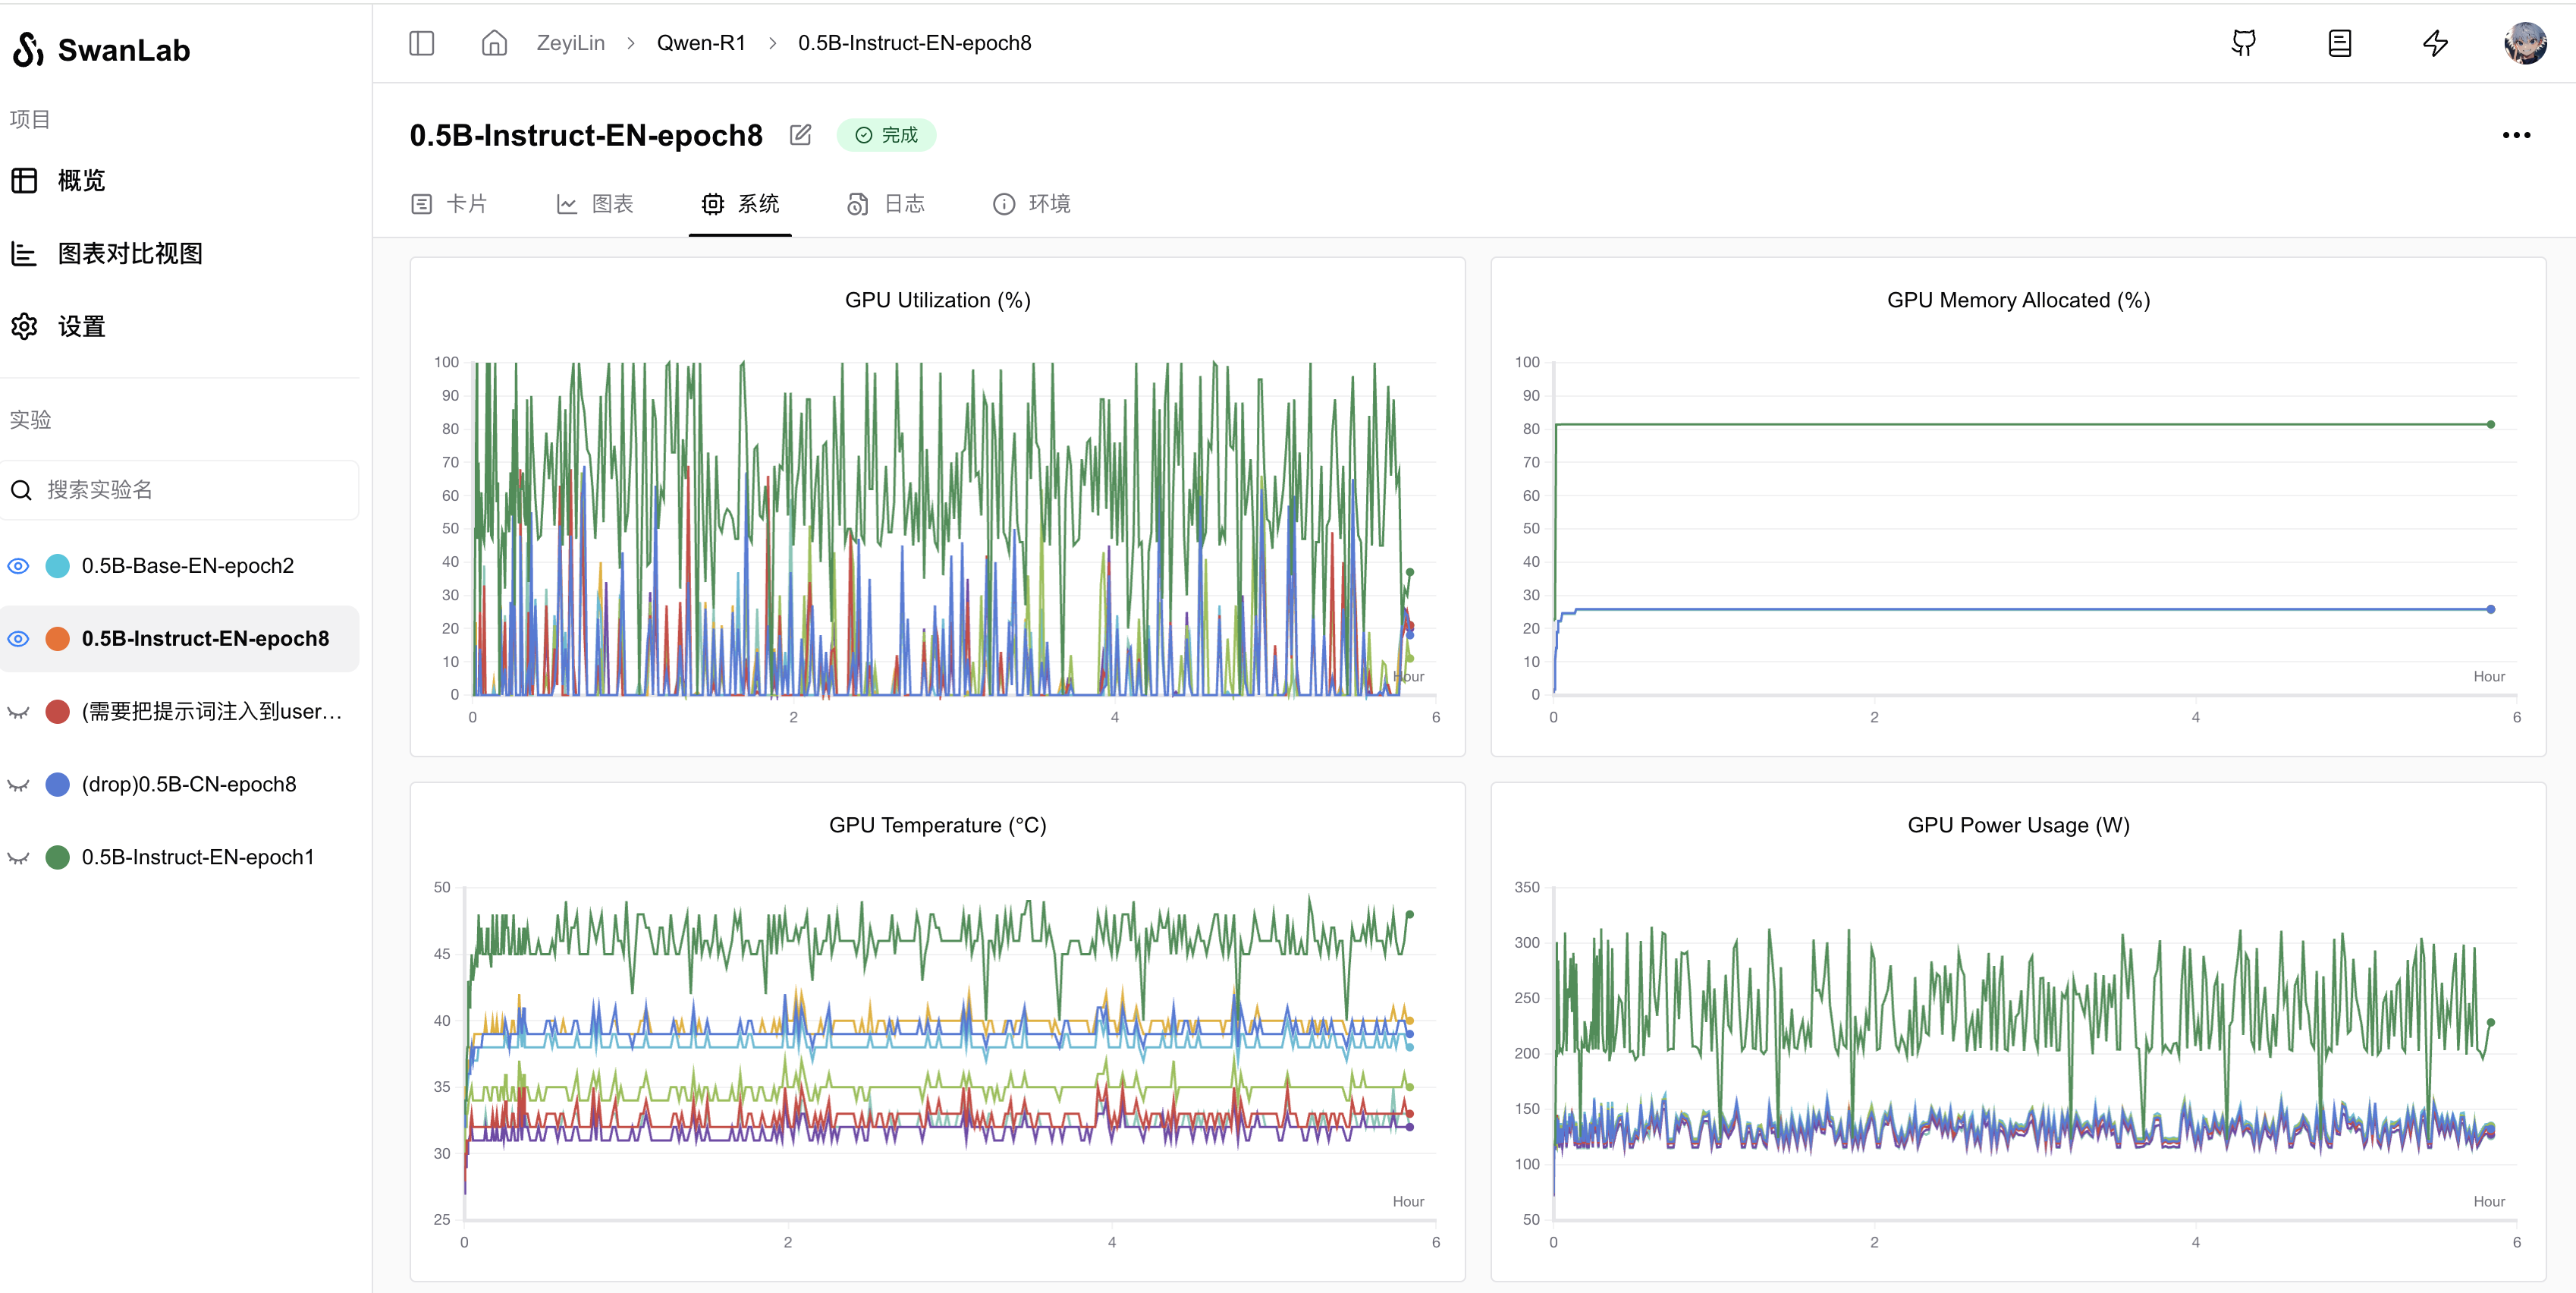
System Monitoring Metrics
SwanLab automatically monitors hardware resources on the machine running the experiment and generates charts for each metric, displayed under the System Charts tab.
Sampling Strategy & Frequency: SwanLab dynamically adjusts hardware data collection frequency based on experiment duration to balance granularity and system performance. Sampling frequencies:
| Data Points Collected | Sampling Frequency |
|---|---|
| 0~10 | Every 10 seconds |
| 10~50 | Every 30 seconds |
| 50+ | Every 60 seconds |
SwanLab monitors GPU, NPU, CPU, system memory, disk I/O, and network metrics relevant to training processes. Below are detailed descriptions of each component.
GPU (NVIDIA)

On multi-GPU machines, each GPU's metrics are recorded separately, displayed as individual lines in charts.
| Metric | Description |
|---|---|
| GPU Memory Allocated (%) | GPU memory utilization – Percentage of VRAM used. |
| GPU Memory Allocated (MB) | GPU memory usage – VRAM consumption in MB. Chart Y-axis capped at the maximum VRAM across GPUs. |
| GPU Utilization (%) | GPU utilization – Percentage of computational resources used. |
| GPU Temperature (℃) | GPU temperature in Celsius. |
| GPU Power Usage (W) | GPU power consumption in watts. |
| GPU Time Spent Accessing Memory (%) | Memory access time – Percentage of time spent accessing VRAM. |
GPU (AMD)

On multi-GPU machines, each GPU's metrics are recorded separately, displayed as individual lines in charts.
| Metric | Description |
|---|---|
| GPU Memory Allocated (%) | GPU memory utilization – Percentage of VRAM used. |
| GPU Memory Allocated (MB) | GPU memory usage – VRAM consumption in MB. Chart Y-axis capped at the maximum VRAM across GPUs. |
| GPU Utilization (%) | GPU utilization – Percentage of computational resources used. |
| GPU Temperature (℃) | GPU temperature in Celsius. |
| GPU Power Usage (W) | GPU power consumption in watts. |
NPU (Ascend)

On multi-NPU machines, each NPU's metrics are recorded separately.
| Metric | Description |
|---|---|
| NPU Utilization (%) | NPU computational utilization. |
| NPU Memory Allocated (MB) | NPU memory usage – VRAM consumption in MB. Chart Y-axis capped at the maximum VRAM across GPUs. |
| NPU Memory Allocated (%) | NPU memory utilization. |
| NPU Temperature (℃) | NPU temperature in Celsius. |
| NPU Power (W) | NPU power draw in watts. |
MLU (Cambricon)

On multi-MLU machines, each MLU's metrics are recorded separately.
| Metric | Description |
|---|---|
| MLU Utilization (%) | MLU computational utilization. |
| MLU Memory Allocated (MB) | MLU memory usage – VRAM consumption in MB. Chart Y-axis capped at the maximum VRAM across GPUs. |
| MLU Memory Allocated (%) | MLU memory utilization. |
| MLU Temperature (℃) | MLU temperature in Celsius. |
| MLU Power (W) | MLU power draw in watts. |
XPU (Kunlunxin)

On multi-XPU machines, each XPU's metrics are recorded separately.
| Metric | Description |
|---|---|
| XPU Utilization (%) | XPU computational utilization. |
| XPU Memory Allocated (MB) | XPU memory usage – VRAM consumption in MB. Chart Y-axis capped at the maximum VRAM across GPUs. |
| XPU Memory Allocated (%) | XPU memory utilization. |
| XPU Temperature (℃) | XPU temperature in Celsius. |
| XPU Power (W) | XPU power draw in watts. |
GPU (MooreThread)

On multi-GPU machines, each GPU's metrics are recorded separately.
| Metric | Description |
|---|---|
| GPU Utilization (%) | GPU computational utilization. |
| GPU Memory Allocated (MB) | GPU memory usage – VRAM consumption in MB. Chart Y-axis capped at the maximum VRAM across GPUs. |
| GPU Memory Allocated (%) | GPU memory utilization. |
| GPU Temperature (℃) | GPU temperature in Celsius. |
| GPU Power (W) | GPU power draw in watts. |
GPU (MetaX)

On multi-GPU machines, each GPU's metrics are recorded separately.
| Metric | Description |
|---|---|
| GPU Utilization (%) | GPU computational utilization. |
| GPU Memory Allocated (MB) | GPU memory usage – VRAM consumption in MB. Chart Y-axis capped at the maximum VRAM across GPUs. |
| GPU Memory Allocated (%) | GPU memory utilization. |
| GPU Temperature (℃) | GPU temperature in Celsius. |
| GPU Power (W) | GPU power draw in watts. |
GPU (Iluvatar)
On multi-GPU machines, each GPU's metrics are recorded separately.
| Metric | Description |
|---|---|
| GPU Utilization (%) | GPU computational utilization. |
| GPU Memory Allocated (MB) | GPU memory usage – VRAM consumption in MB. Chart Y-axis capped at the maximum VRAM across GPUs. |
| GPU Memory Allocated (%) | GPU memory utilization. |
| GPU Temperature (℃) | GPU temperature in Celsius. |
| GPU Power (W) | GPU power draw in watts. |
DCU (Hygon)
On multi-DCU machines, each DCU's metrics are recorded separately.
| Metric | Description |
|---|---|
| DCU Utilization (%) | DCU computational utilization. |
| DCU Memory Allocated (MB) | DCU memory usage – VRAM consumption in MB. Chart Y-axis capped at the maximum VRAM across GPUs. |
| DCU Memory Allocated (%) | DCU memory utilization. |
| DCU Temperature (℃) | DCU temperature in Celsius. |
| DCU Power (W) | DCU power draw in watts. |
CPU
| Metric | Description |
|---|---|
| CPU Utilization (%) | CPU computational utilization. |
| Process CPU Threads | Thread count used by the experiment. |
Memory
| Metric | Description |
|---|---|
| System Memory Utilization (%) | System-wide memory usage percentage. |
| Process Memory In Use (non-swap) (MB) | Physical memory (excluding swap) consumed by the process. |
| Process Memory Utilization (MB) | Allocated memory (including swap) for the process. |
| Process Memory Available (non-swap) (MB) | Available physical memory (excluding swap) for the process. |
Disk
| Metric | Description |
|---|---|
| Disk IO Utilization (MB) | Disk I/O throughput in MB/s (read/write shown separately). |
| Disk Utilization (%) | Disk usage percentage. |
On Linux, monitors root (/) usage; on Windows, monitors system drive (typically C:).
Network
| Metric | Description |
|---|---|
| Network Traffic (KB) | Network I/O throughput in KB/s (receive/transmit shown separately). |
Network read/write speeds in KB/s, displayed as separate lines for receive/transmit rates.