Viewing Experiment Results
Leverage SwanLab's powerful experiment dashboard to manage and visualize AI model training results in one place.
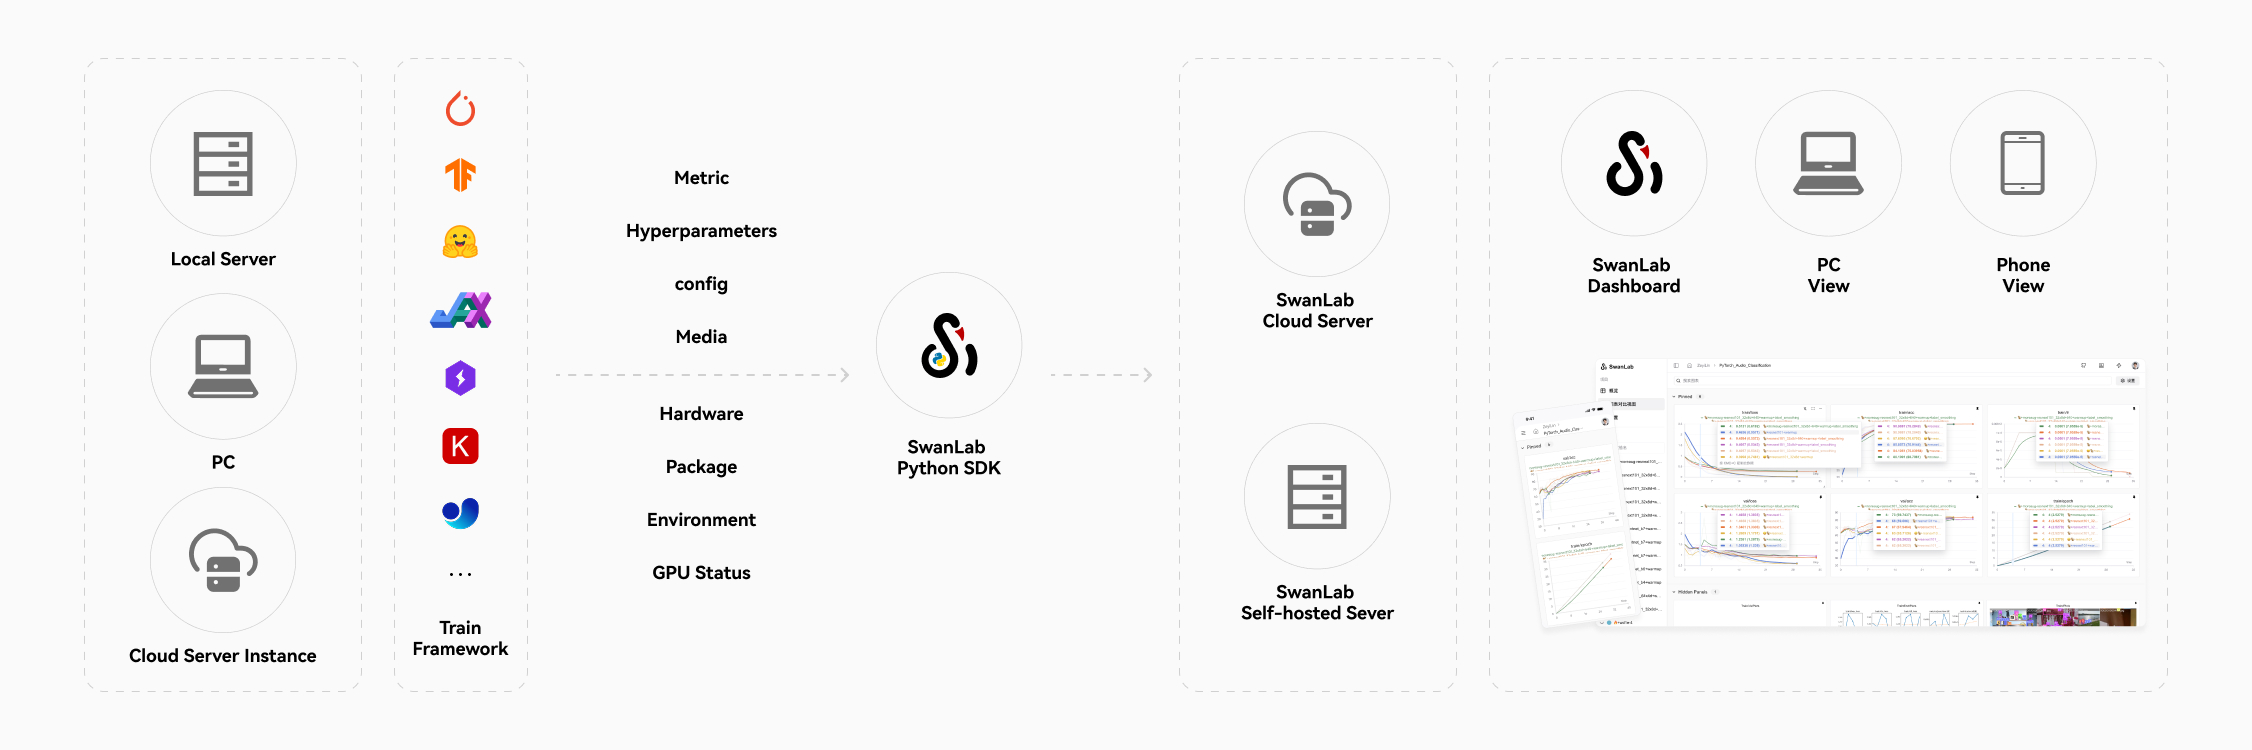
Cloud Synchronization
No matter where you train your model—your local machine, a lab server cluster, or cloud instances—we seamlessly collect and consolidate your training data. Access progress anytime, anywhere, even on your phone.
No more manually screenshotting terminal outputs or copying data into Excel. Forget about managing TensorBoard files across different machines—SwanLab handles it all effortlessly.
📱 Mobile Experiment Monitoring
Ever had an experiment running while you're away from your computer—working out, commuting, or just waking up—and desperately wanted to check its progress? Your phone + SwanLab is the perfect solution. Learn more
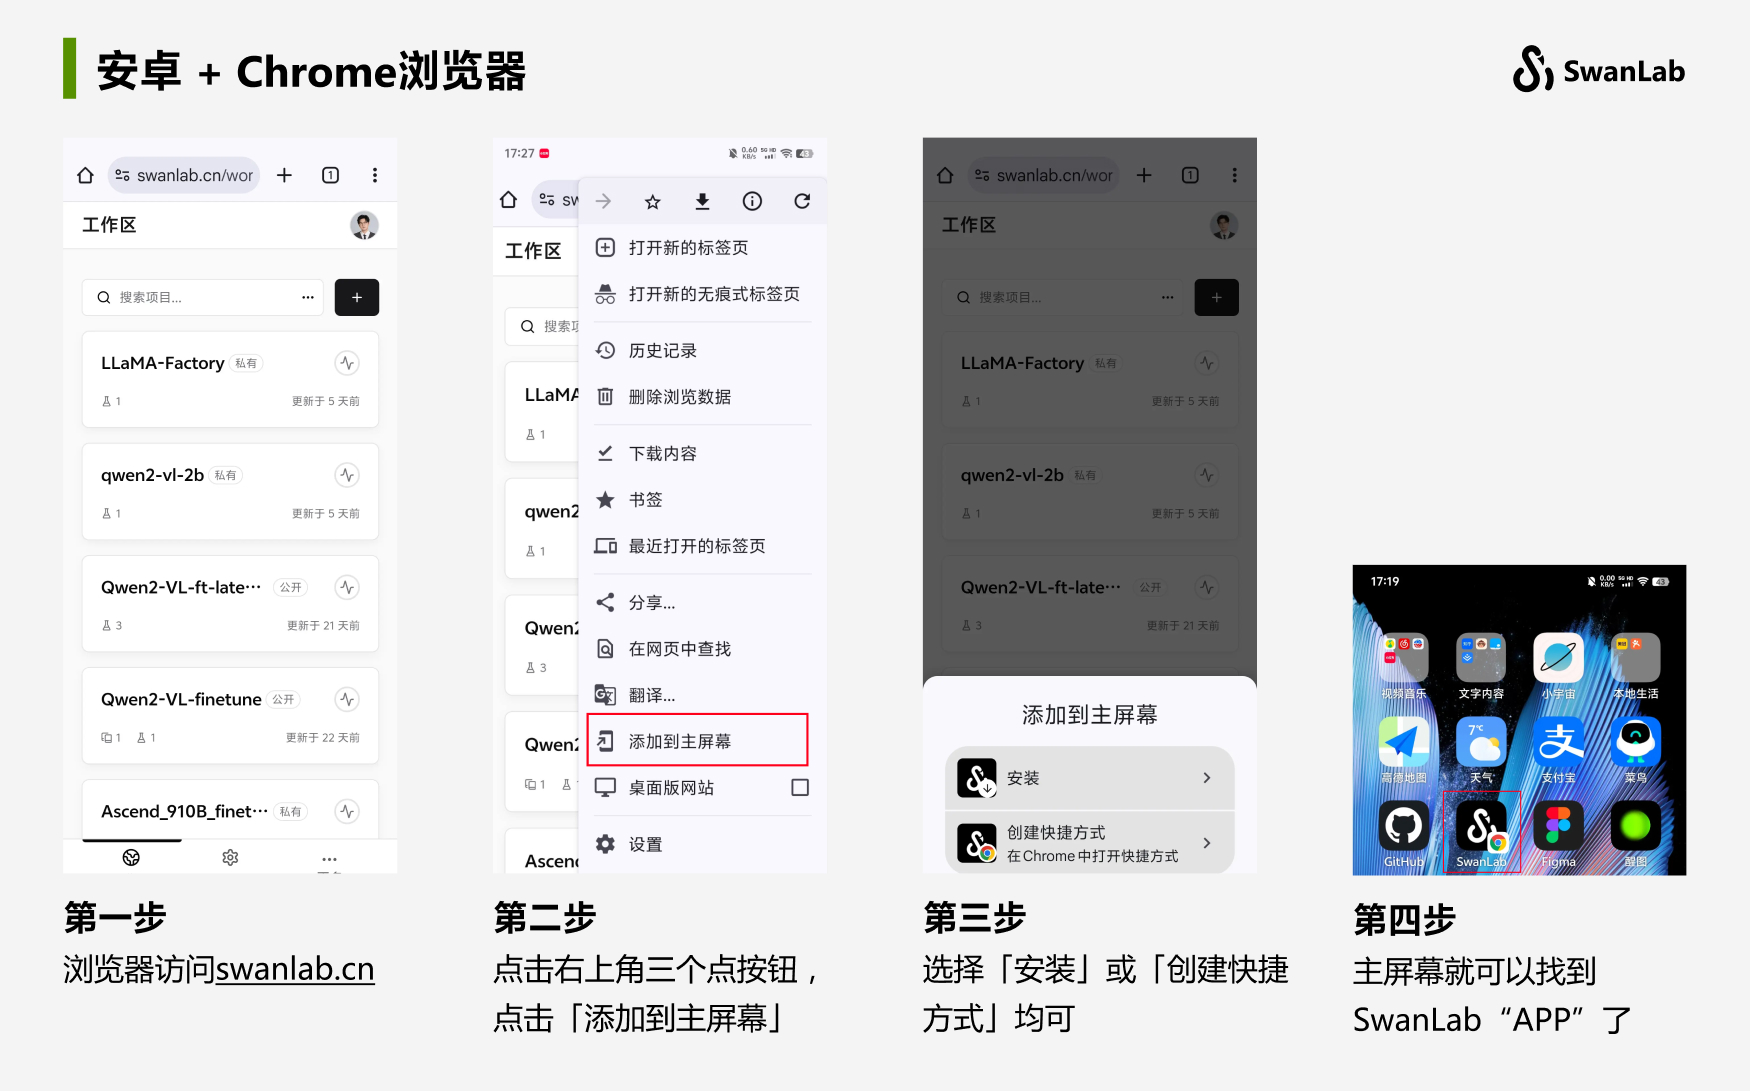
Table View
Compare training experiments in table view to track hyperparameter changes.
By default, data is sorted by: [Experiment Name] - [Metadata] - [Configuration] - [Metrics].
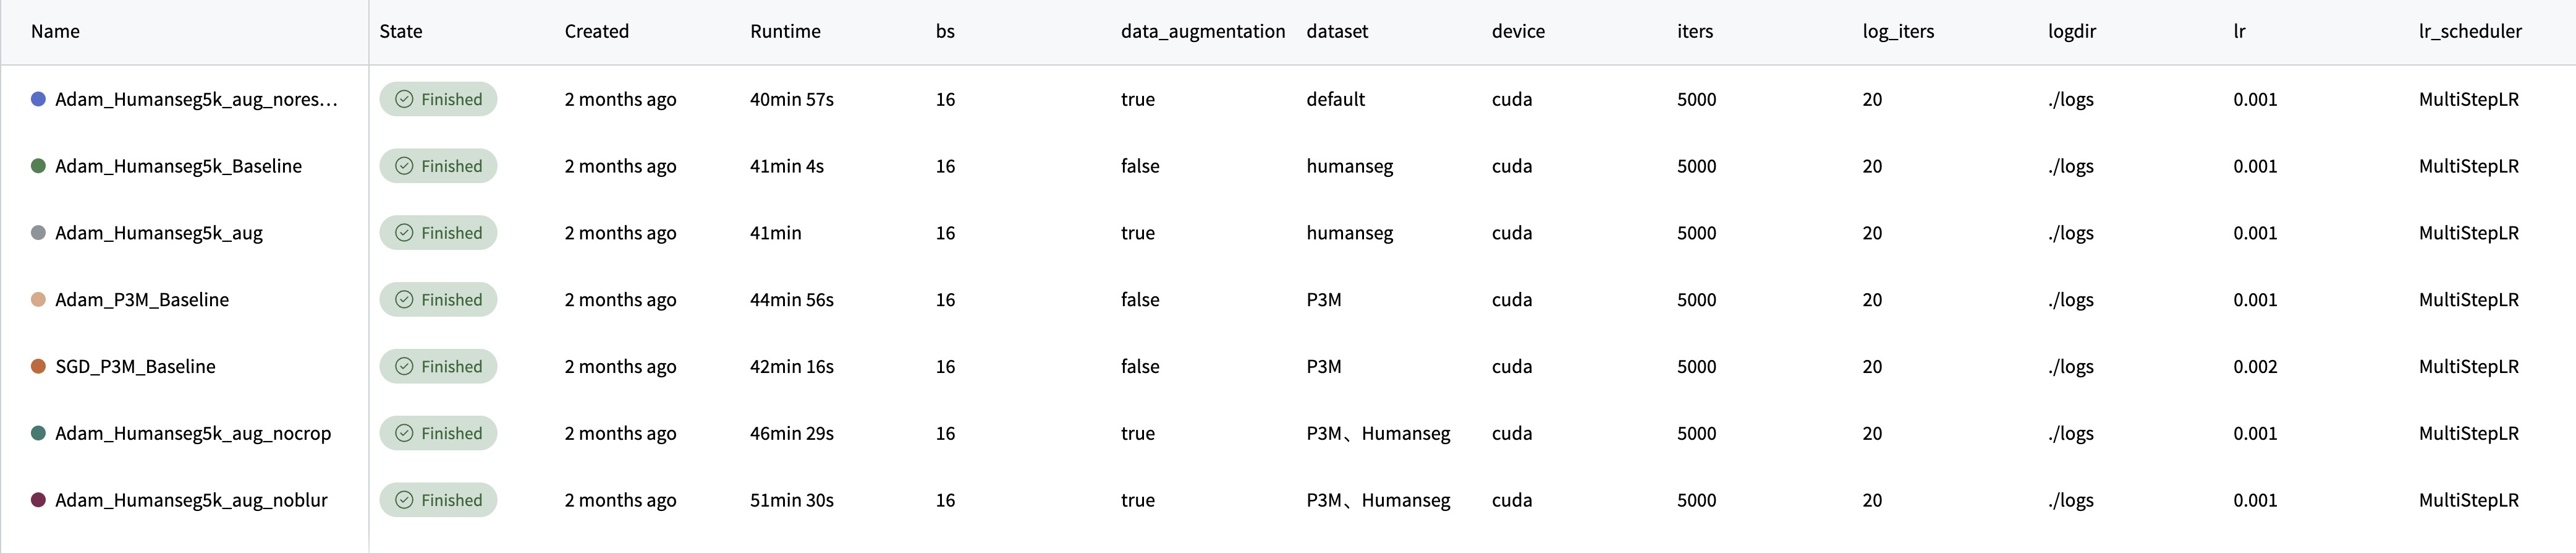
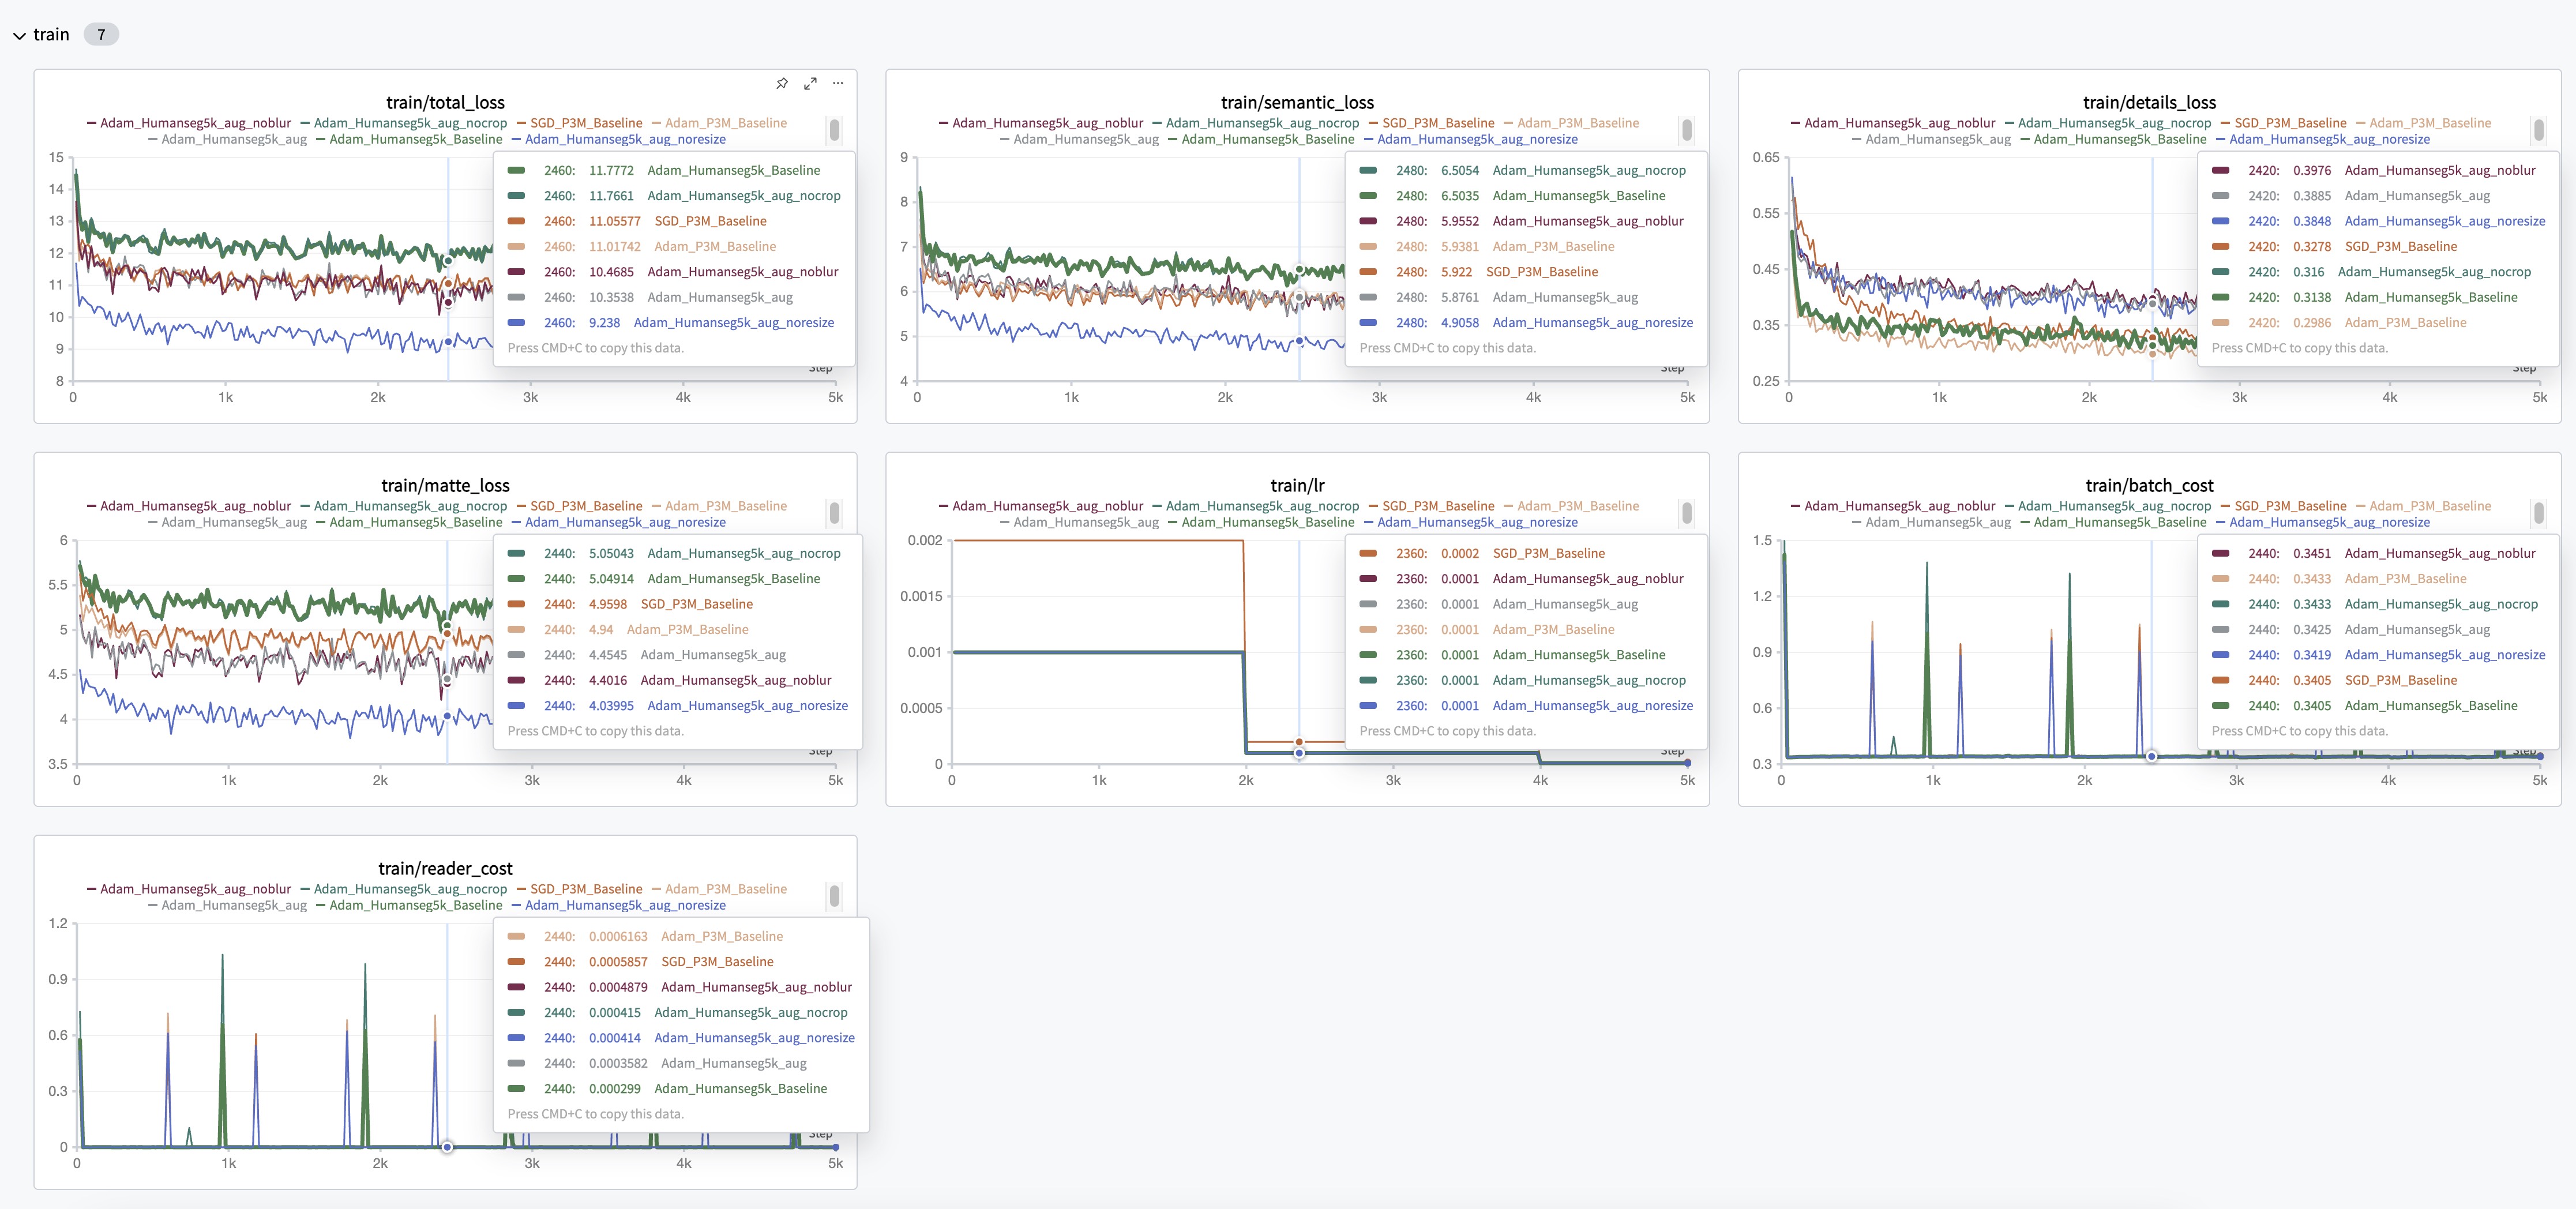
Chart Comparison View
The Chart Comparison View consolidates experiment charts into a unified multi-experiment visualization.
Easily compare how different experiments perform on the same metric, identifying trends and variations at a glance.
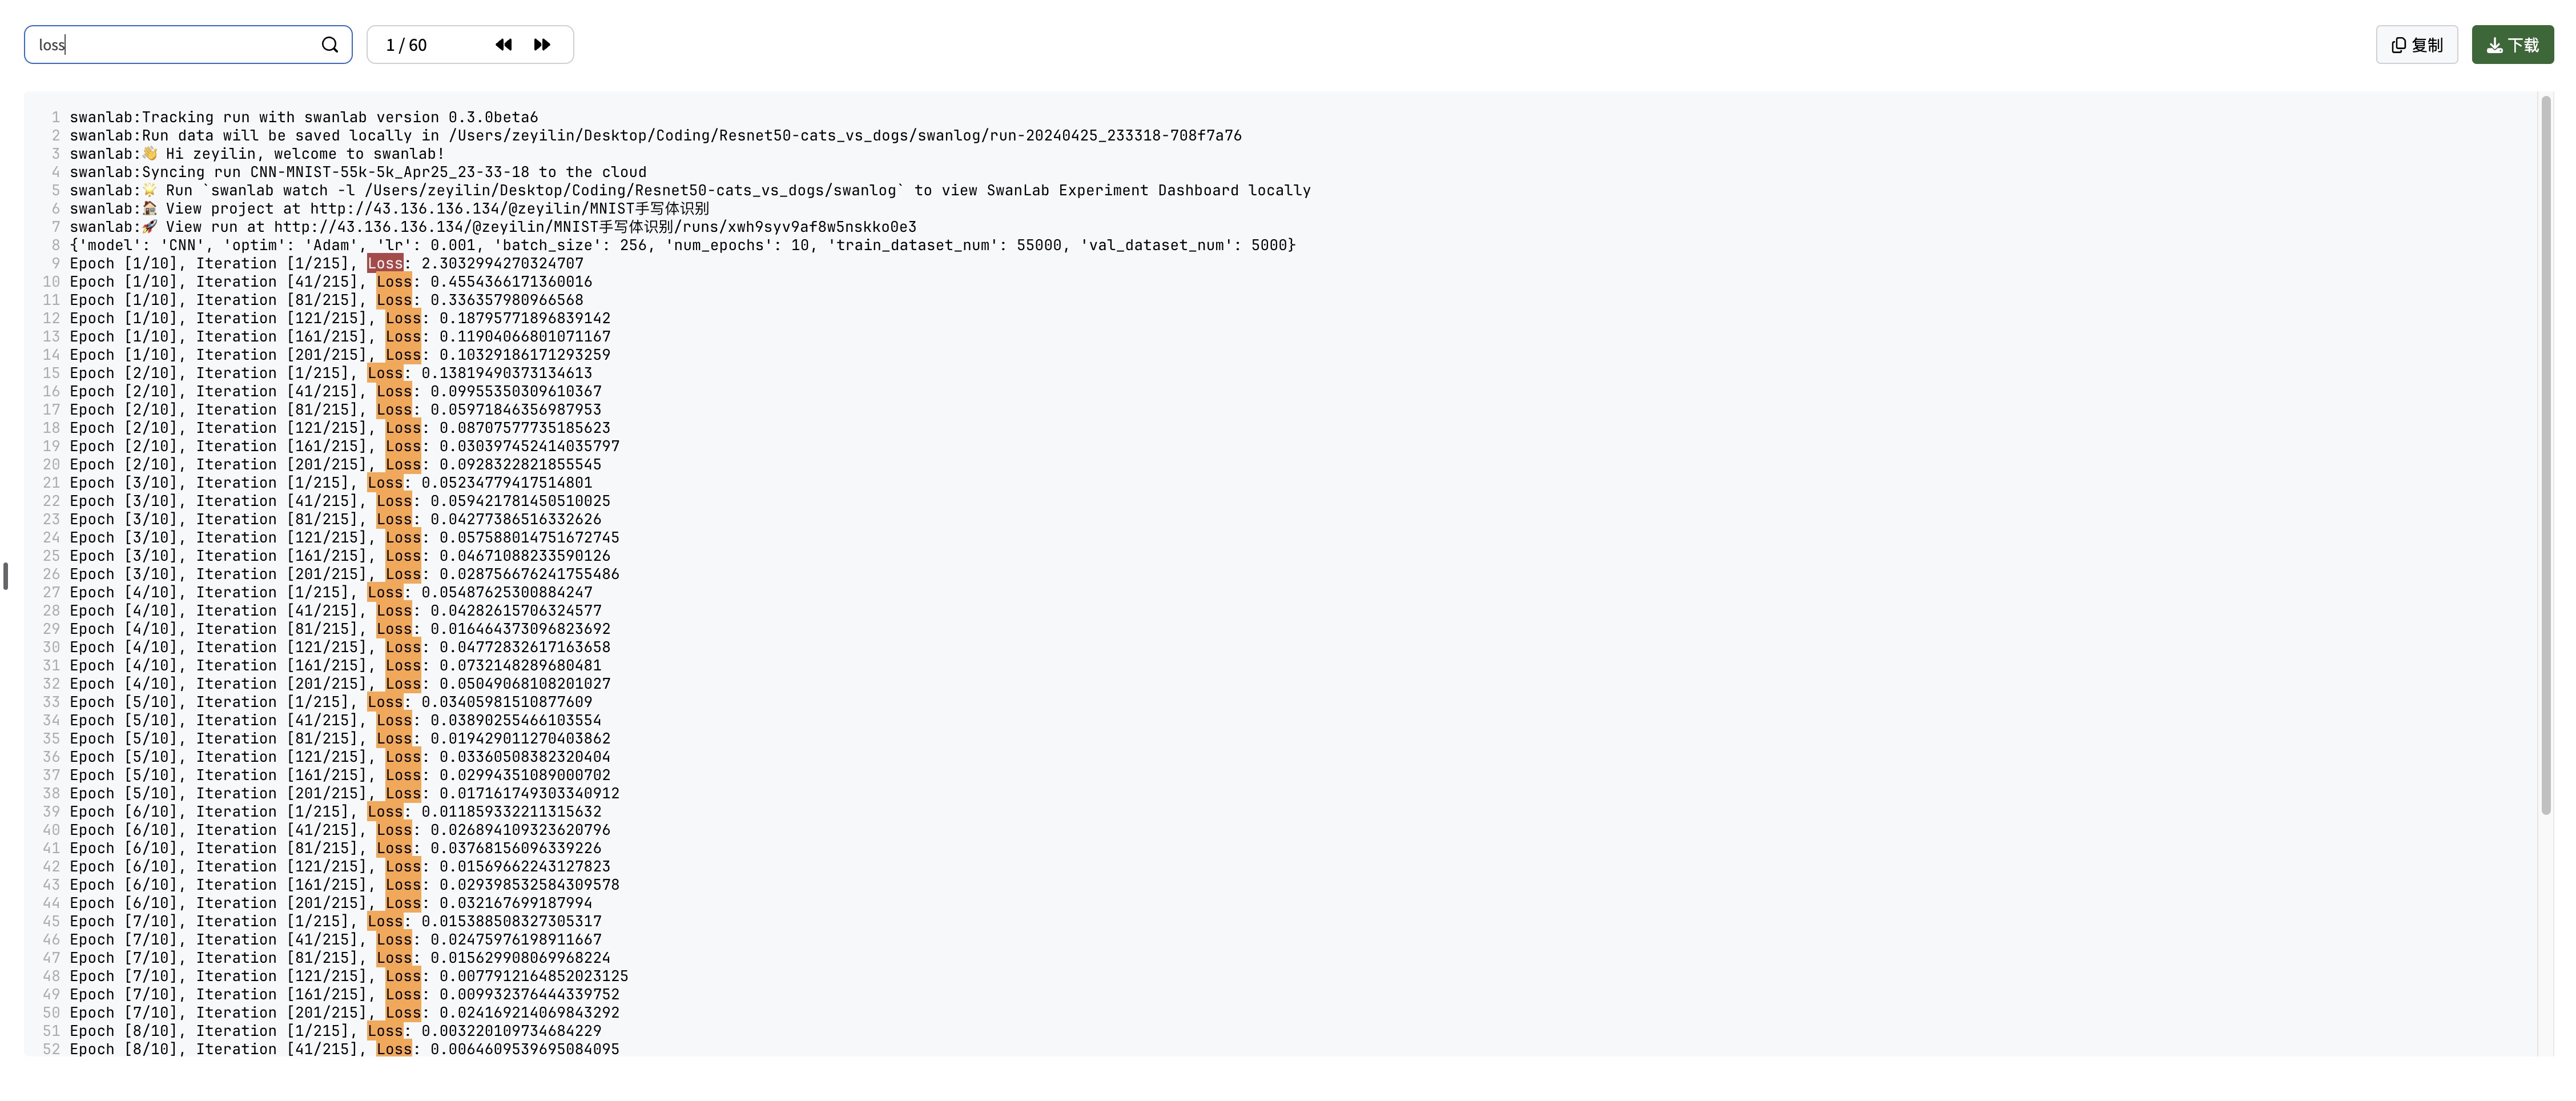
Logs
From swanlab.init to experiment completion, SwanLab records all terminal output in the Logs tab—viewable, copyable, and downloadable anytime. Search functionality helps pinpoint critical details.
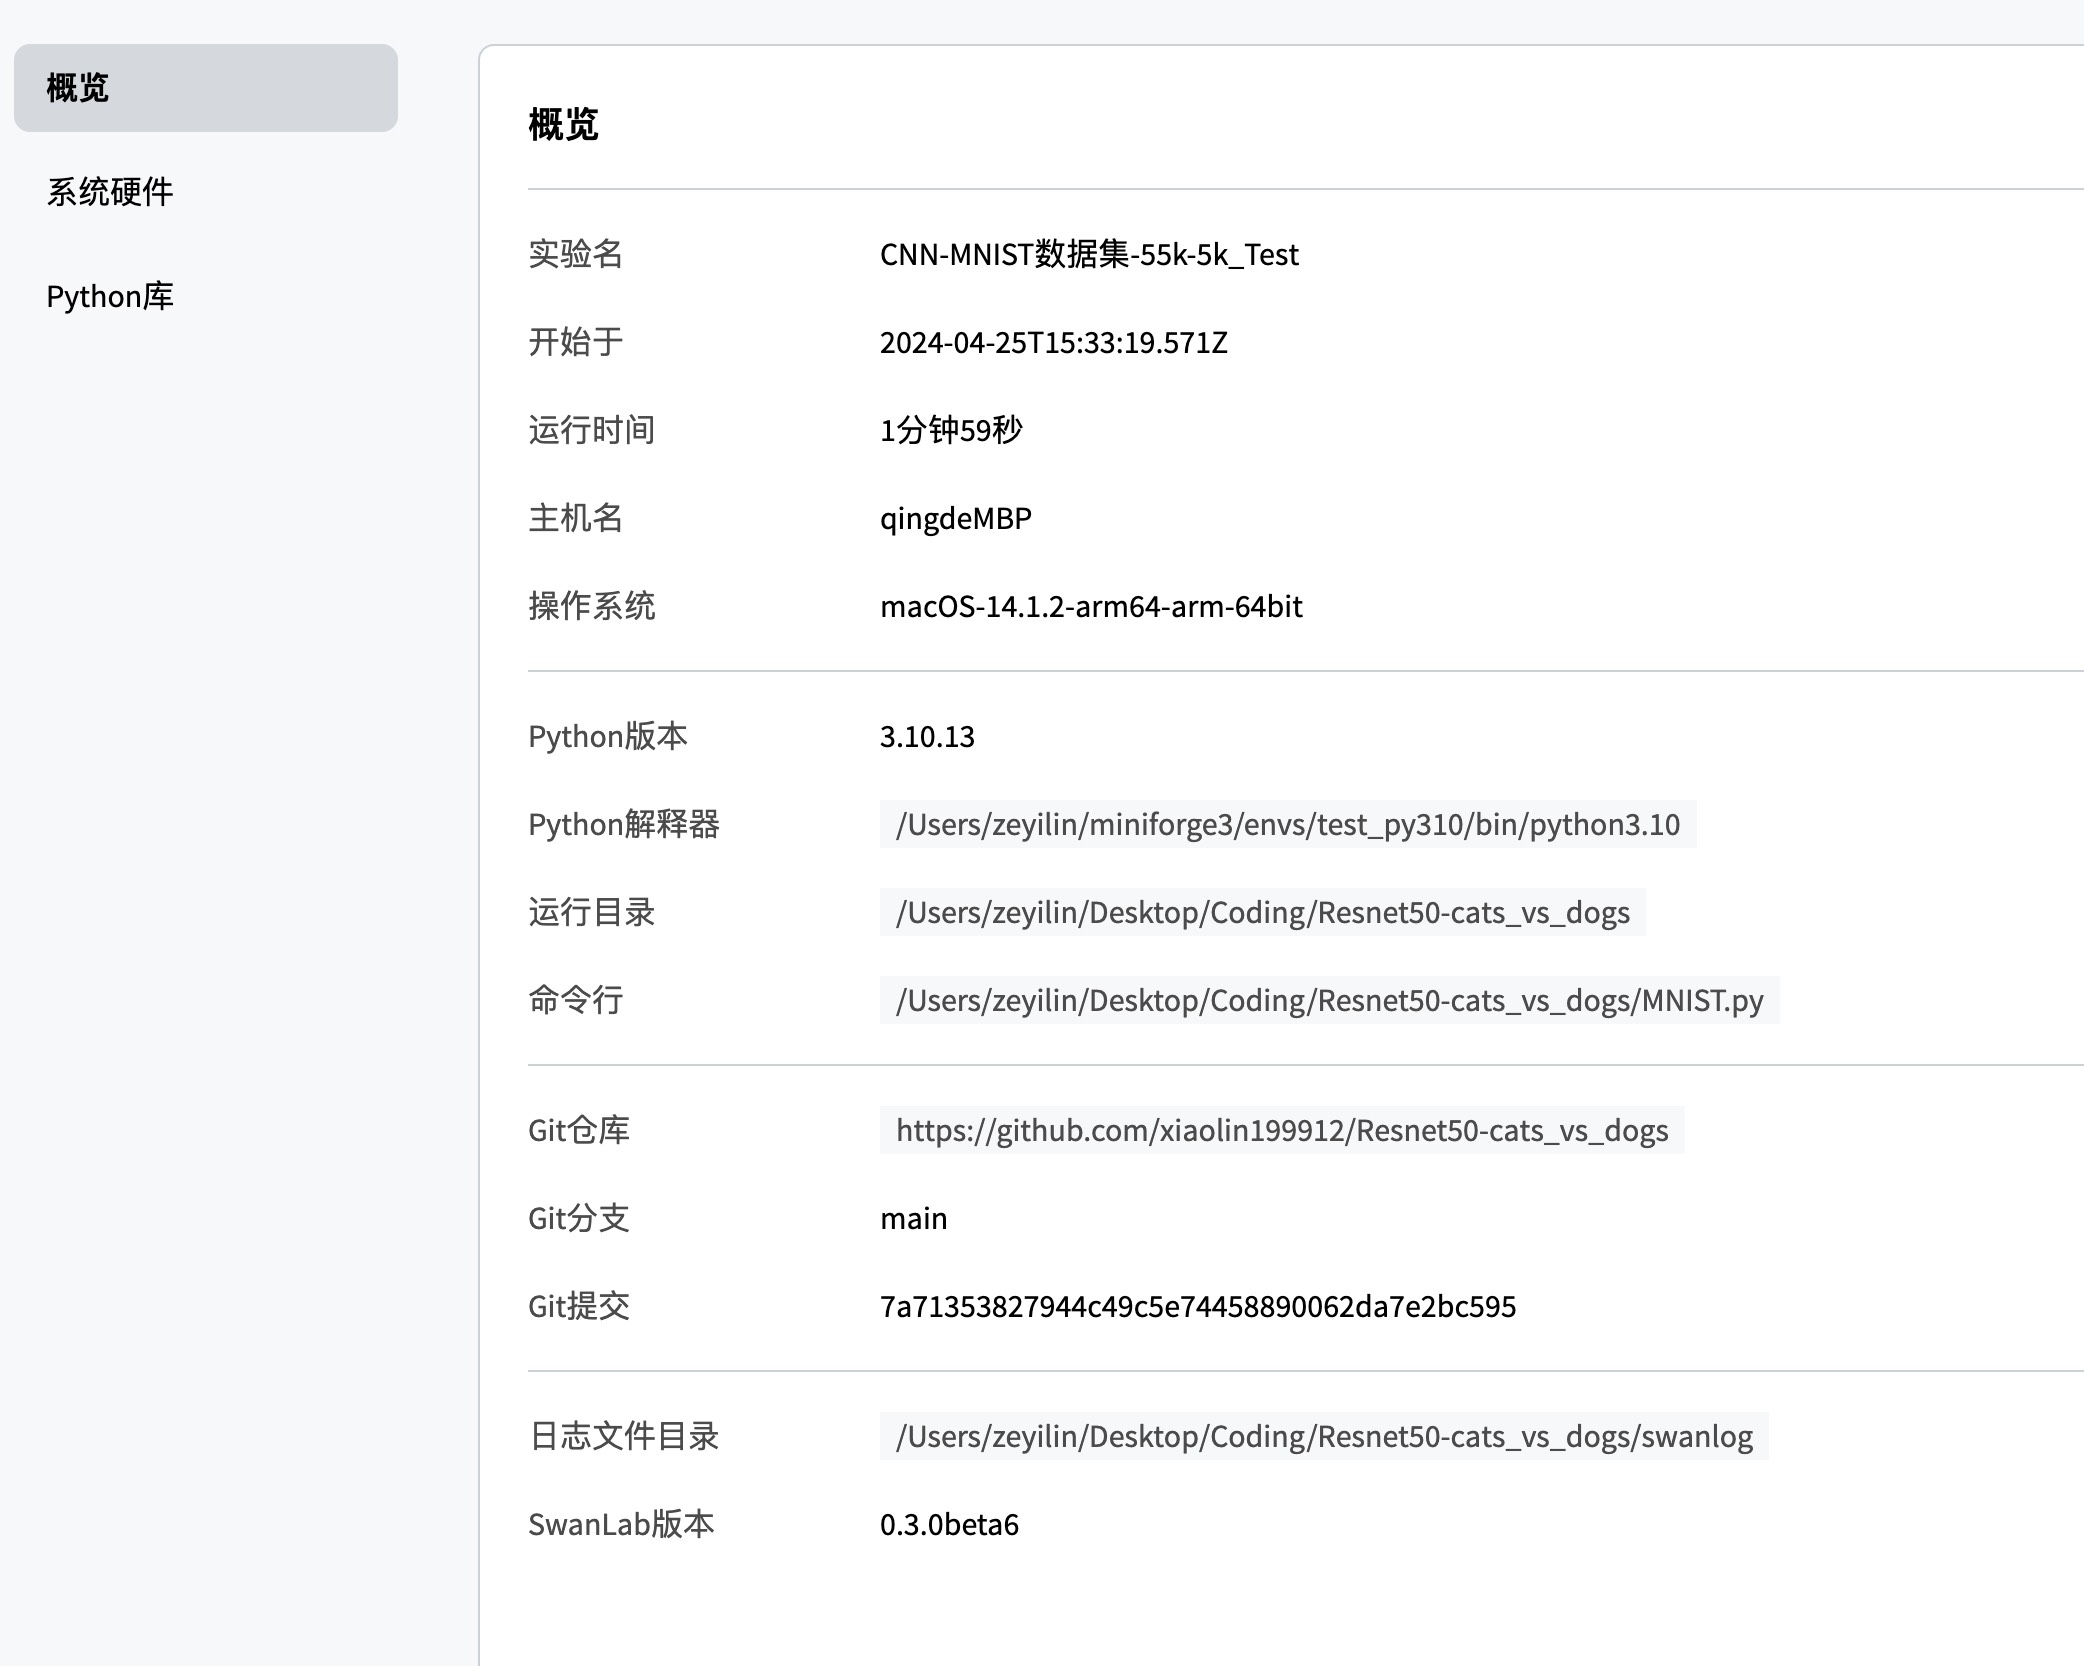
Environment
SwanLab automatically logs training environment details, including:
- Basic Info: Runtime, hostname, OS, Python version, interpreter path, working directory, command line, Git repo URL, branch, commit, log directory, SwanLab version
- System Hardware: CPU cores, memory size, GPU count, GPU model, VRAM
- Python Dependencies: All installed Python packages in the runtime environment