
Multi-View
Create multiple independent dashboards within a single project and set up different views for different analysis scenarios. Each view saves its own chart configuration, allowing you to switch analytical perspectives with one click.
📊 Frontend Chart Updates
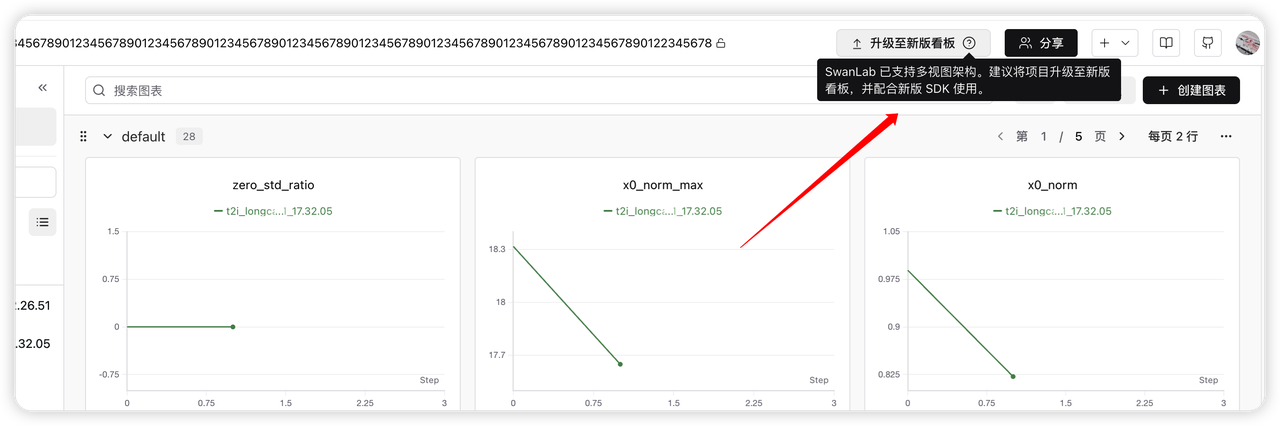
Open the project you want to upgrade and click the "Upgrade to New Dashboard" button in the upper-right corner to complete the upgrade to the Multi-View dashboard. Please note:
- Projects created through the WebUI must be manually upgraded to the new Multi-View dashboard
- New projects created using SDK ≥ 0.10.0 automatically use the Multi-View dashboard, with no manual upgrade required
⚠️ Notes
- After upgrading a project to the new dashboard, you must use SwanLab SDK ≥ 0.10.0. Make sure the SDK in your training environment is updated to the latest version
- The legacy interface for projects that have not been upgraded will no longer be maintained after November 15th, 2026. You will need to switch to the new SwanLab charts to conduct expriments.
After upgrading, we recommend checking the following:
- Review the view layout: Existing features will be retained, but the view layout will be reset to the default. Adjust it as needed
- Configure custom views manually: When creating a custom view, the system does not add charts automatically. Select and configure the metric charts you want to focus on
Multi-View Overview
Multi-View supports multiple independent dashboards within a single project. Each view can independently save its filters, grouping method, and chart layout. Adjusting the current view does not affect other views.
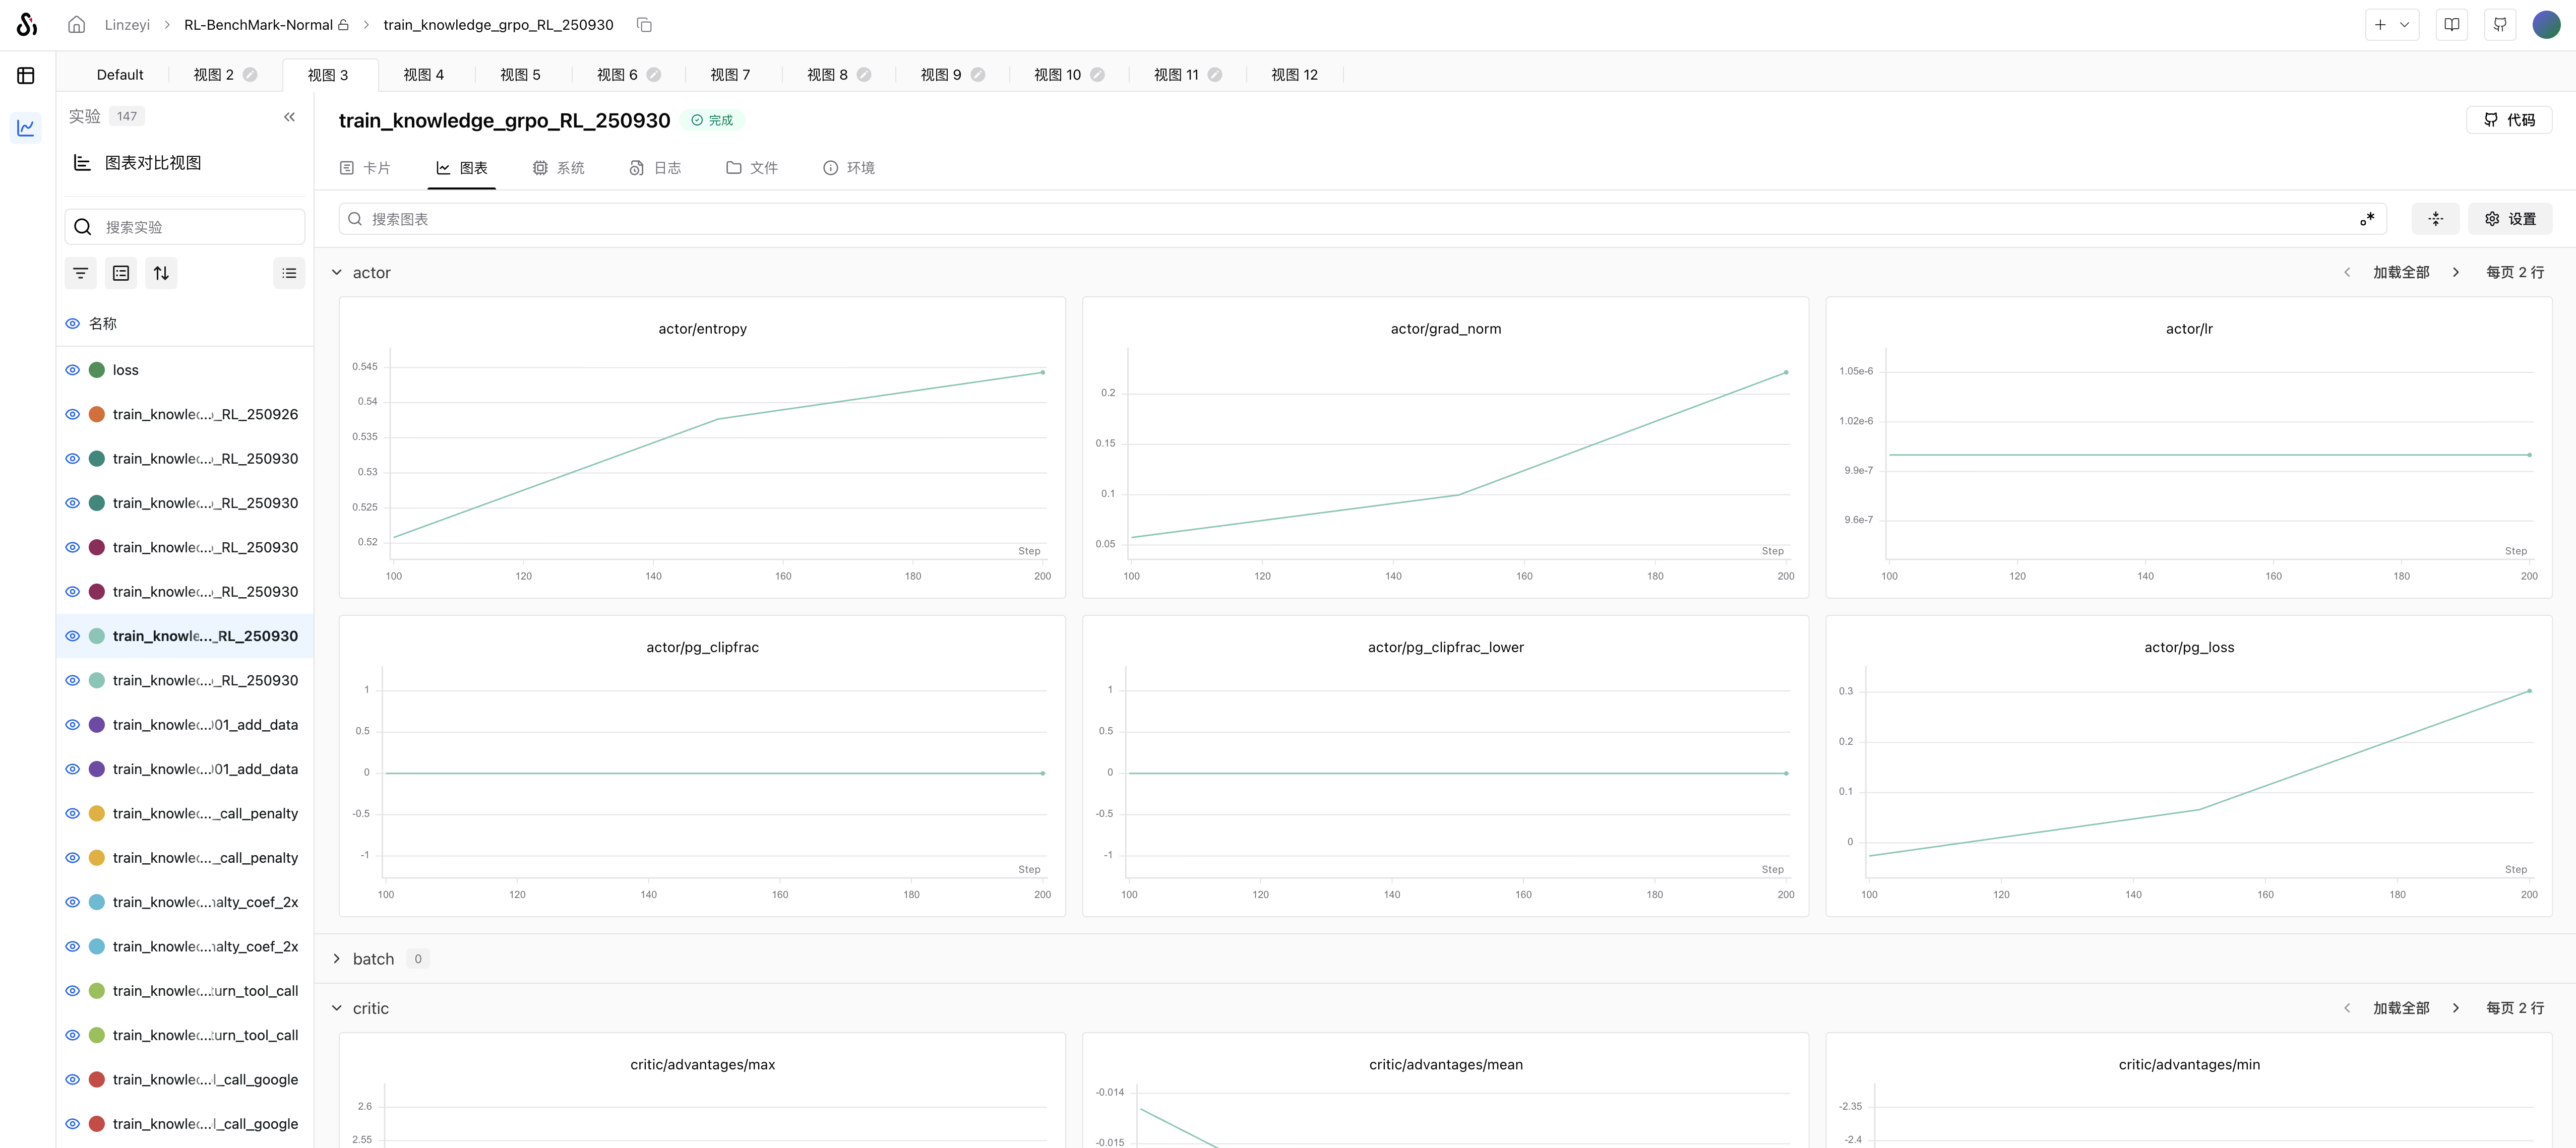
Multi-View helps you:
- Meet different analysis needs: Create separate views for experiment monitoring, model comparison, result reproduction, and more
- Switch analysis scenarios quickly: No need to repeatedly adjust configurations; switch views to see the corresponding content
- Keep view configurations independent: Adjusting the current view does not change the saved content of other views
- Improve team collaboration: Reduce conflicts when multiple people adjust dashboards and maintain stable analysis environments
Default Views and Custom Views
When creating a view, you can choose between two types:
- Default view: Automatically renders charts for all logged metrics. Ideal for quick validation and when you need a complete overview of your data
- Custom view: Starts with a blank canvas, where you manually select and configure the metric charts you care about. Ideal when you have many metrics or need to focus on comparing key data during hyperparameter tuning
Personal Views and Public Views
Views support two visibility scopes. You can set a view as personal or public based on your individual or team collaboration needs:
- Personal view: Visible only to you, so you can organize it freely according to your preferences
- Public view: Visible to all project collaborators, making it ideal as a shared dashboard for the team
Managing Views
Each project supports multiple views, allowing you to flexibly organize and compare experiment data for different scenarios. You can also reorder, rename, pin, and duplicate views for easier management.
- Reorder: Drag and drop to place frequently used views where they are most convenient
- Rename: Rename a view at any time so its purpose is clear at a glance
- Pin a view: Pin your most important views to the front
- Duplicate a view: Quickly create a copy of an existing view and fine-tune it
Chart Layout Sync
Within the same view, the layouts of multi-experiment comparison charts and single-experiment charts stay in sync. Any adjustments to charts or groups are synchronized between the two, ensuring a consistent viewing experience across dimensions.